
You are here:
Explore and Visualize Your Data Interactively
Data exploration is an iterative process. It typically involves these steps: view, explore, refine, save, and share.
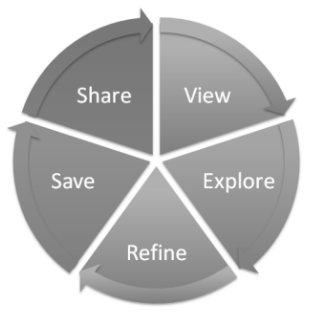
- View—View the dataset.
- Explore—Get to know the boundaries and shape of your data. Play with different views, zoom in and zoom out, and see what you get with different charting options.
- Refine—Narrow your view to the most important data. Decide the level of detail and categorization that’s easiest for your colleagues to understand. Choose the most appropriate chart visualization.
- Save—Save your work.
- Share—Share your view with others. For a more packaged presentation, use your visualization to build a dashboard.
Did this article solve your issue?
Let us know so we can improve!