You are here:
Table Properties
Use table properties to control a table's appearance.
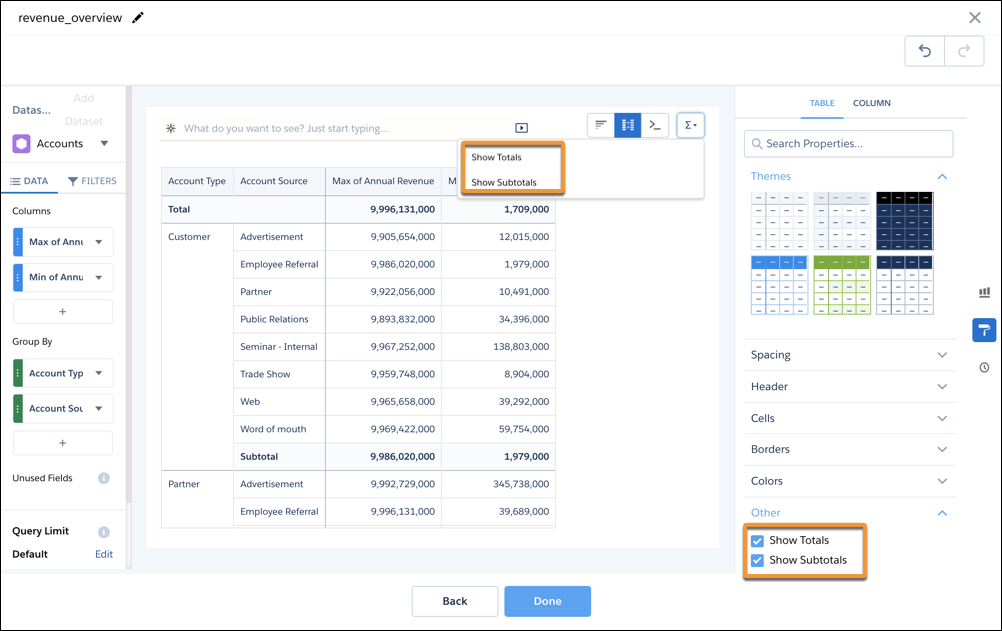
Display Totals and Subtotals
Add totals and subtotals to tables in
the table properties panel or from the  button.
Measure functions are calculated according to all data in the relevant subgrouping. For example, the Total of Max Annual Revenue returns the maximum annual revenue of the entire column. If the formula for the column is A/B, the subtotal is the subtotal of A/subtotal of B. Groups can’t be sorted when subtotals are displayed. Measures can only be sorted within groups (inner sorts) when subtotals are displayed.
Totals and subtotals work by using the rollup statement to calculate totals of grouped data. For more information on the functionality and limitations of totals and subtotals, refer to the rollup section of the group topic in the Analytics SAQL Developer Guide.
If a time series, a window function, or an unsupported aggregate function is used on the data:
- Totals are determined using a window function grand total or weighted average calculation instead of the rollup.
- Subtotals aren’t calculated or displayed, the setting is ignored.
Because subtotals and grand totals use the rollup statement, which is computed before any aggregate filter is applied, subtotals and totals amounts don’t reflect the filter. For example, if you filter out the rows where the sum or amount is greater than $1000, you don’t see any rows greater than $1000, but the totals still include those rows in their value. An aggregate filter can also filter out the total rows themselves. As a best practice, it’s not recommended to use aggregate filters with totals or subtotals.
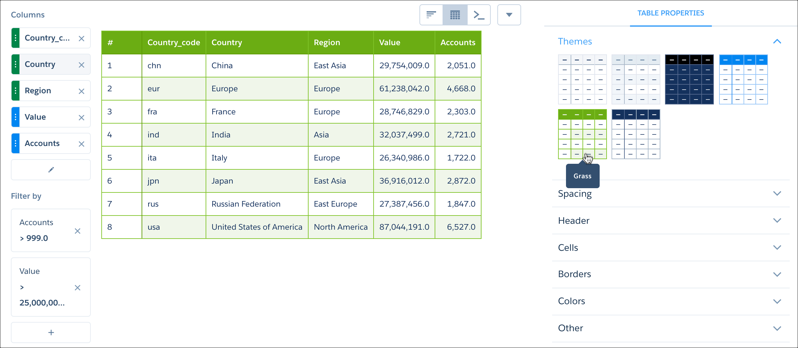
Choose a Table Theme
Click a theme to apply it to a table.
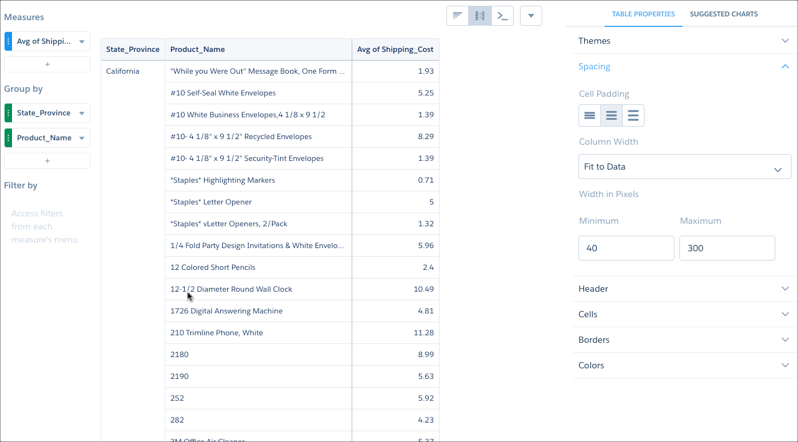
Set the Spacing for Columns and Rows
To increase or decrease the whitespace in all cells, click a Cell Padding tile.
To set column width, select an option from the Column Width dropdown menu, then enter a value or values in Width in Pixels. If you choose Fit to Widget, all columns are brought into view.
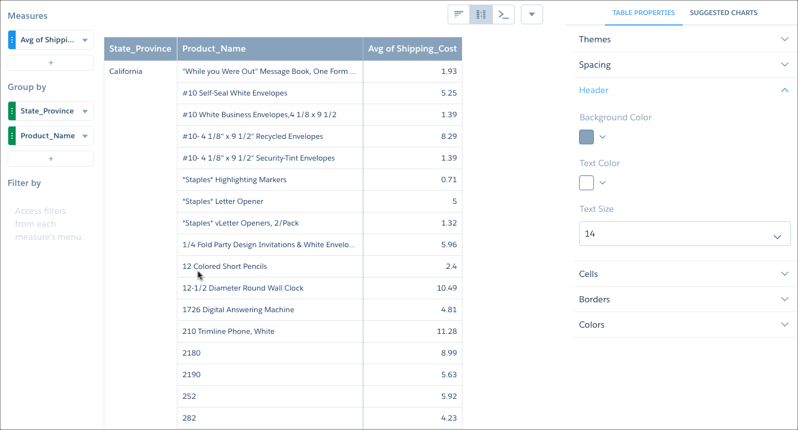
Set Header Row Style
For the header row, you can set the cell background color, and the color and font size for text.
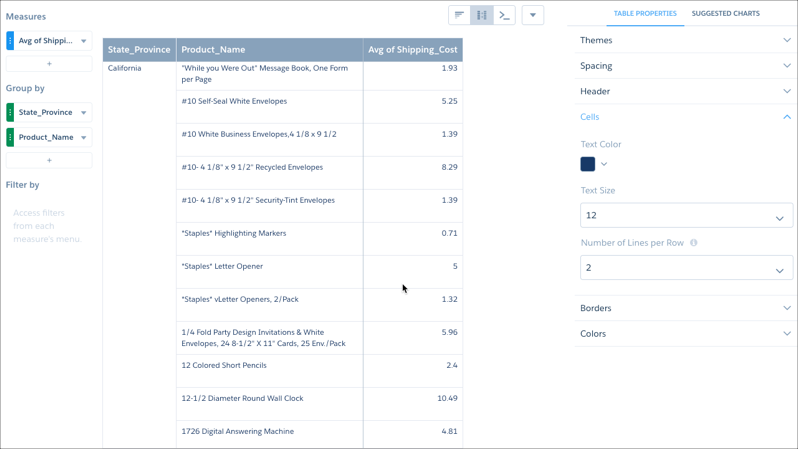
Set Body Row Text Attributes
For body rows, you can set the font size and color for text, and the number of text lines each row displays.
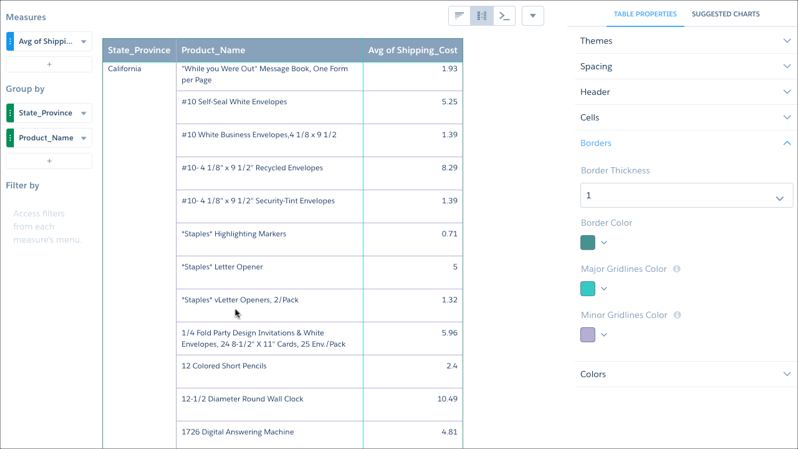
Set Border Styles
To style the table's external border, choose a thickness from Border Thickness and a color from Border Color. For the remaining cell borders, choose colors from Major Gridlines Color and Minor Gridlines Color.
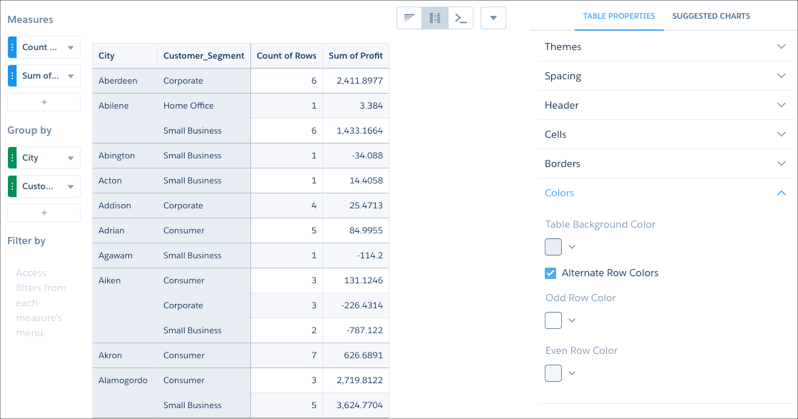
Choose Colors for Body Rows
To set a background color for body rows, choose a color from Table Background Color. To alternate row colors, click Alternate Row Colors, then choose colors for the odd and even rows.
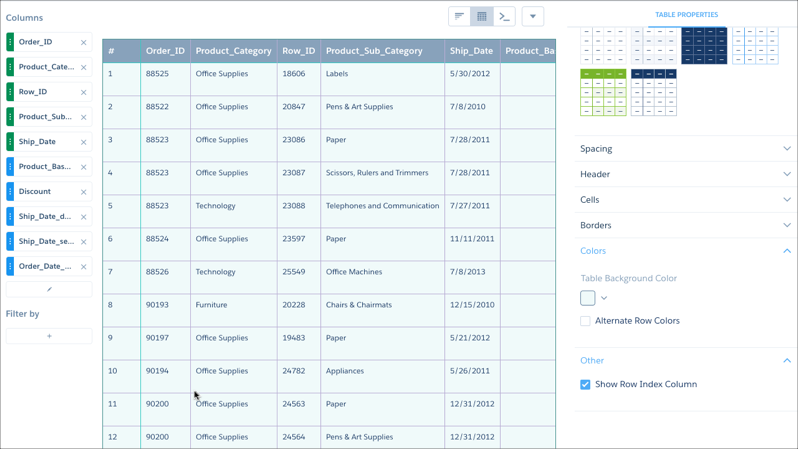
Add an Index Column to Values Tables
To add or remove an index column from a values table, click Show Row Index Column.
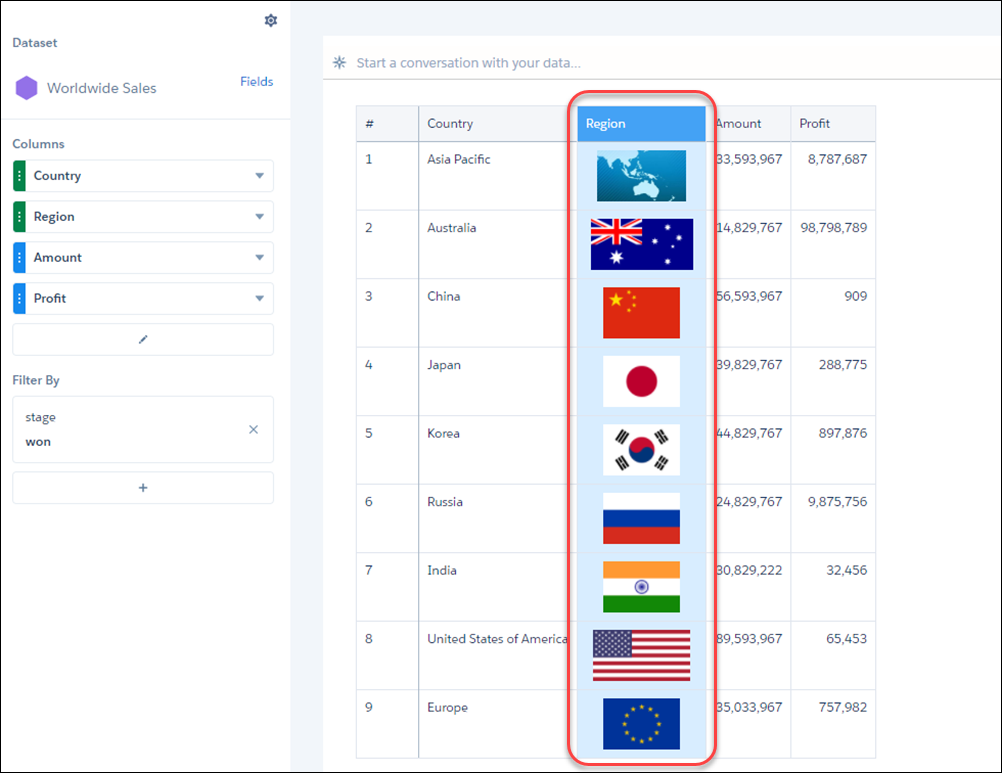
Dress Up Tables with Images
To add or remove an index column from a values table, click Show Row Index Column.
Include reps’ Chatter profile pictures next to their KPIs in leaderboards. Or, add flags to your compare table showing worldwide sales data.
In the column you want to display images, include the Salesforce URLs that point to the images. In Column Properties, set the data type to Image. If you set the cell height or width for this column, we ensure that the images maintain their aspect ratio.