
You are here:
Manage the View of Data in a Values Table
The values table displays all the columns in your dataset. You can customize the view of columns in a values table, and you can sort the row values using any column except for the index column.
On the left-hand side of the values table are measure and dimension (grouping) tiles representing all the visible columns in your dataset. To move a measure or grouping, click and hold its tile, then drag the tile to a new position. Release the tile when the position indicator is in the correct position (1).
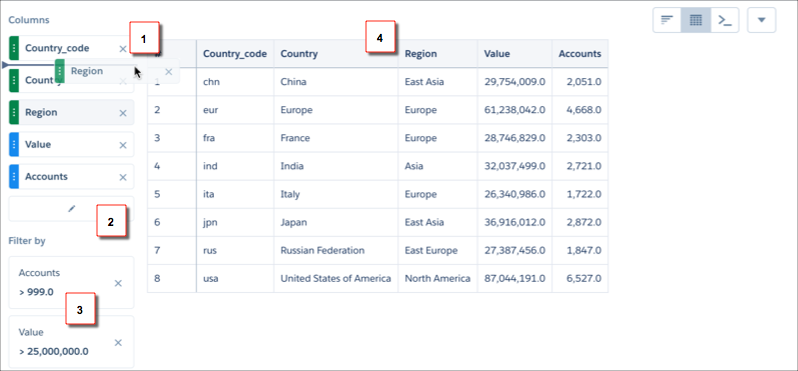
To remove a measure or grouping from the table, click the x button in its tile (1). To access the Edit Columns dialog, where you can hide or show any column, click the pencil button (2). You can also add, edit, or remove filters (3). To sort the rows by a column, click its heading cell until an arrow appears in the direction you want to sort (4).