
You are here:
Clean, Transform, and Load Data with Data Prep
Data Prep provides an intuitive, visual interface in CRM Analytics that allows you to easily point-and-click your way to build recipes that prepare data and load it into a target. Use the graph of a recipe to see at a glance where the data comes from and how it flows through the recipe to the target. To validate the recipe as you build, preview how raw data is transformed at every step of the way.
Watch a Demo:  Introducing Data Prep (English Only)
In Data Prep, a recipe consists of nodes. You can add different types of nodes to a recipe to bring in, manipulate, and write data to a target. Data Prep displays a graph of the recipe and its nodes in the Graph area.
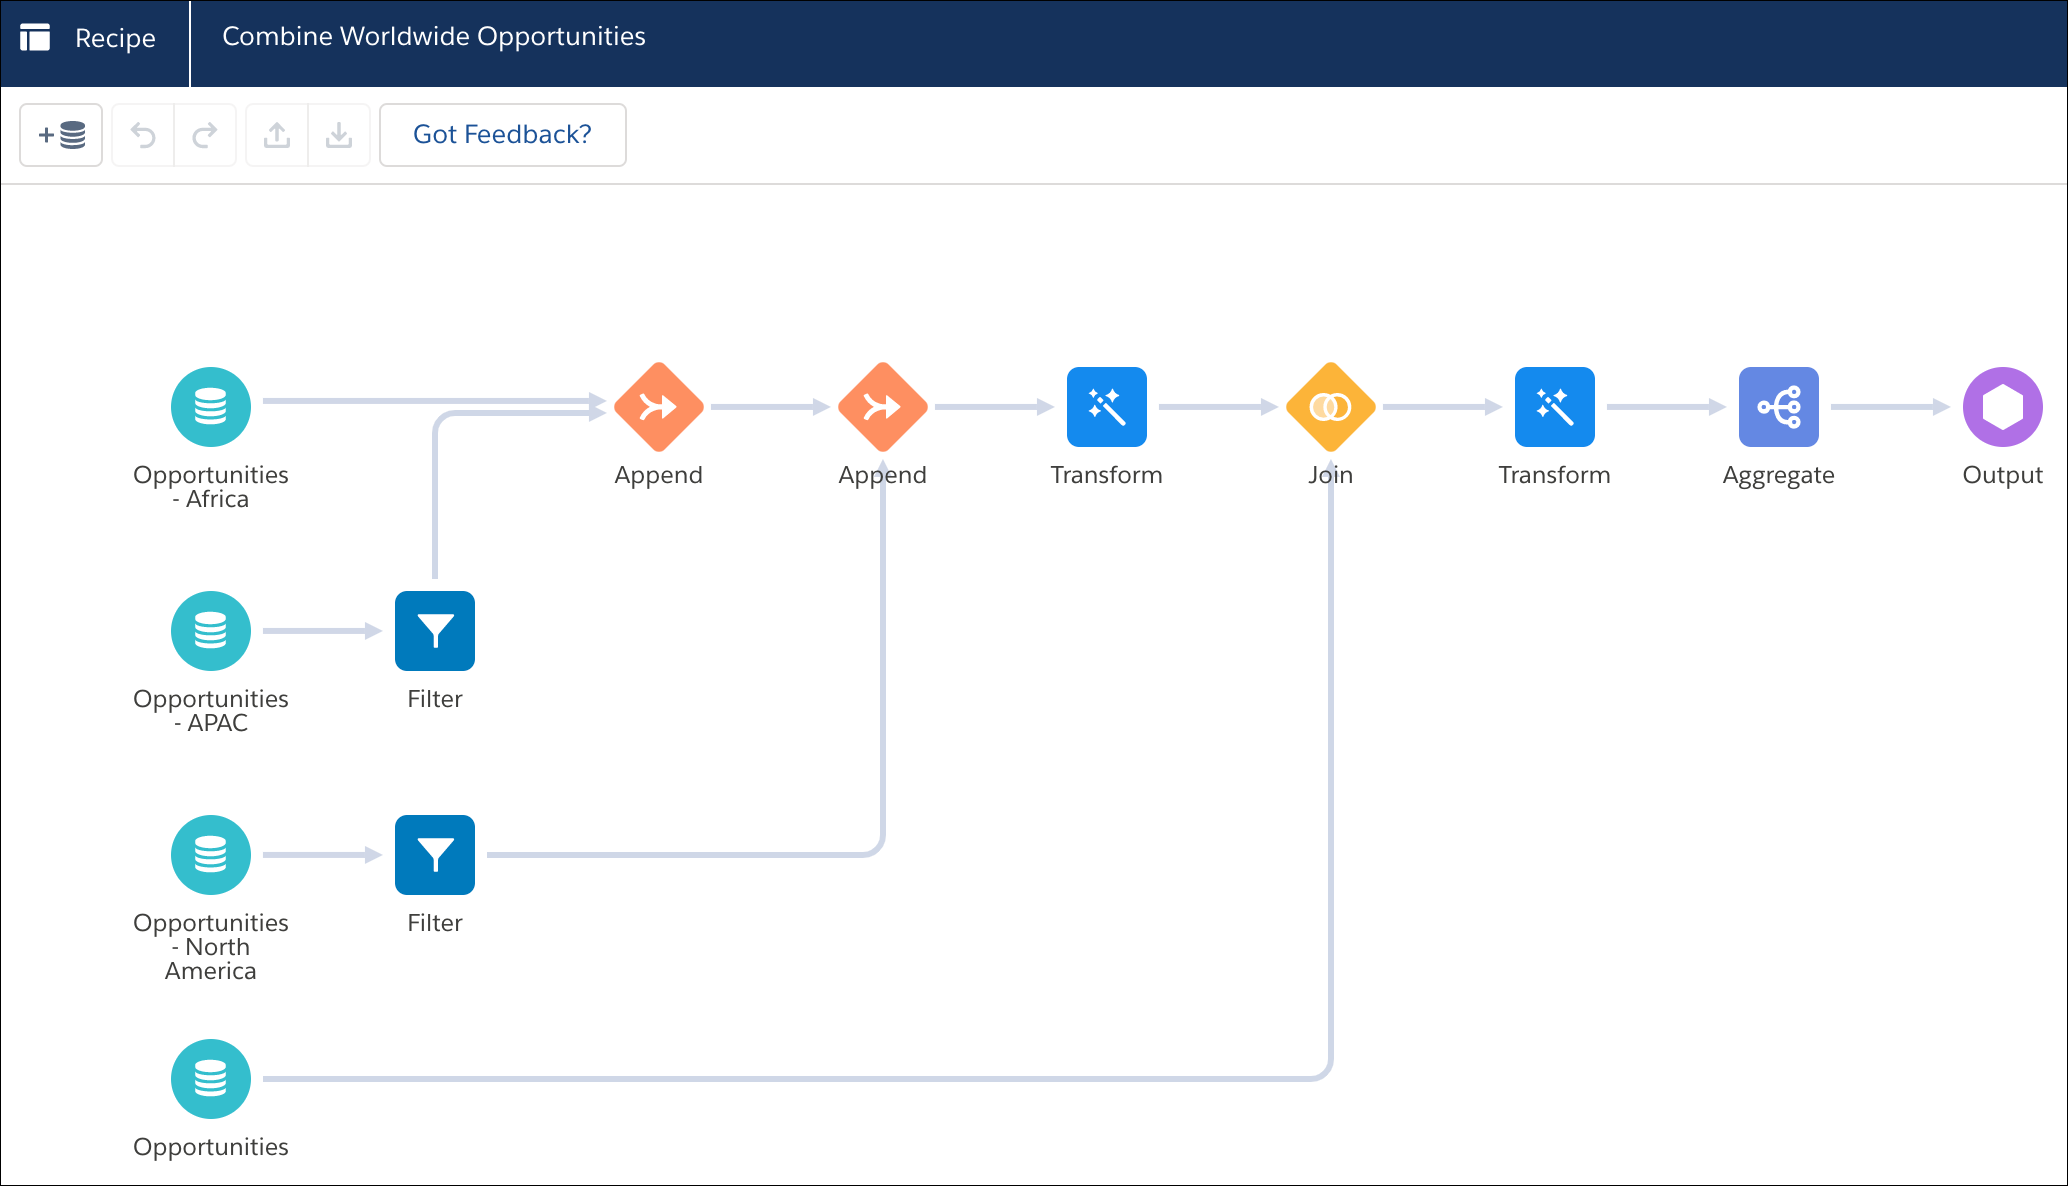
A Data Prep graph doesn’t show every transformation. It shows only inputs (source data), appends, aggregates, filters, joins, and the output (where the data is written). It also shows transforms, which are groups of transformations that change the raw data, such as concatenation and column type conversions. By hiding lower-level data changes, the graph provides a higher-level, easier-to-read view of the flow of data. We call each object shown in the graph a node. A recipe can have multiple Input, Append, Aggregate, Filter, Join, Transform, and Output nodes.
Although the graph doesn’t show individual data transformations, you can select a Transform node (1) in the Graph area to see its transformations in the Details area (2).
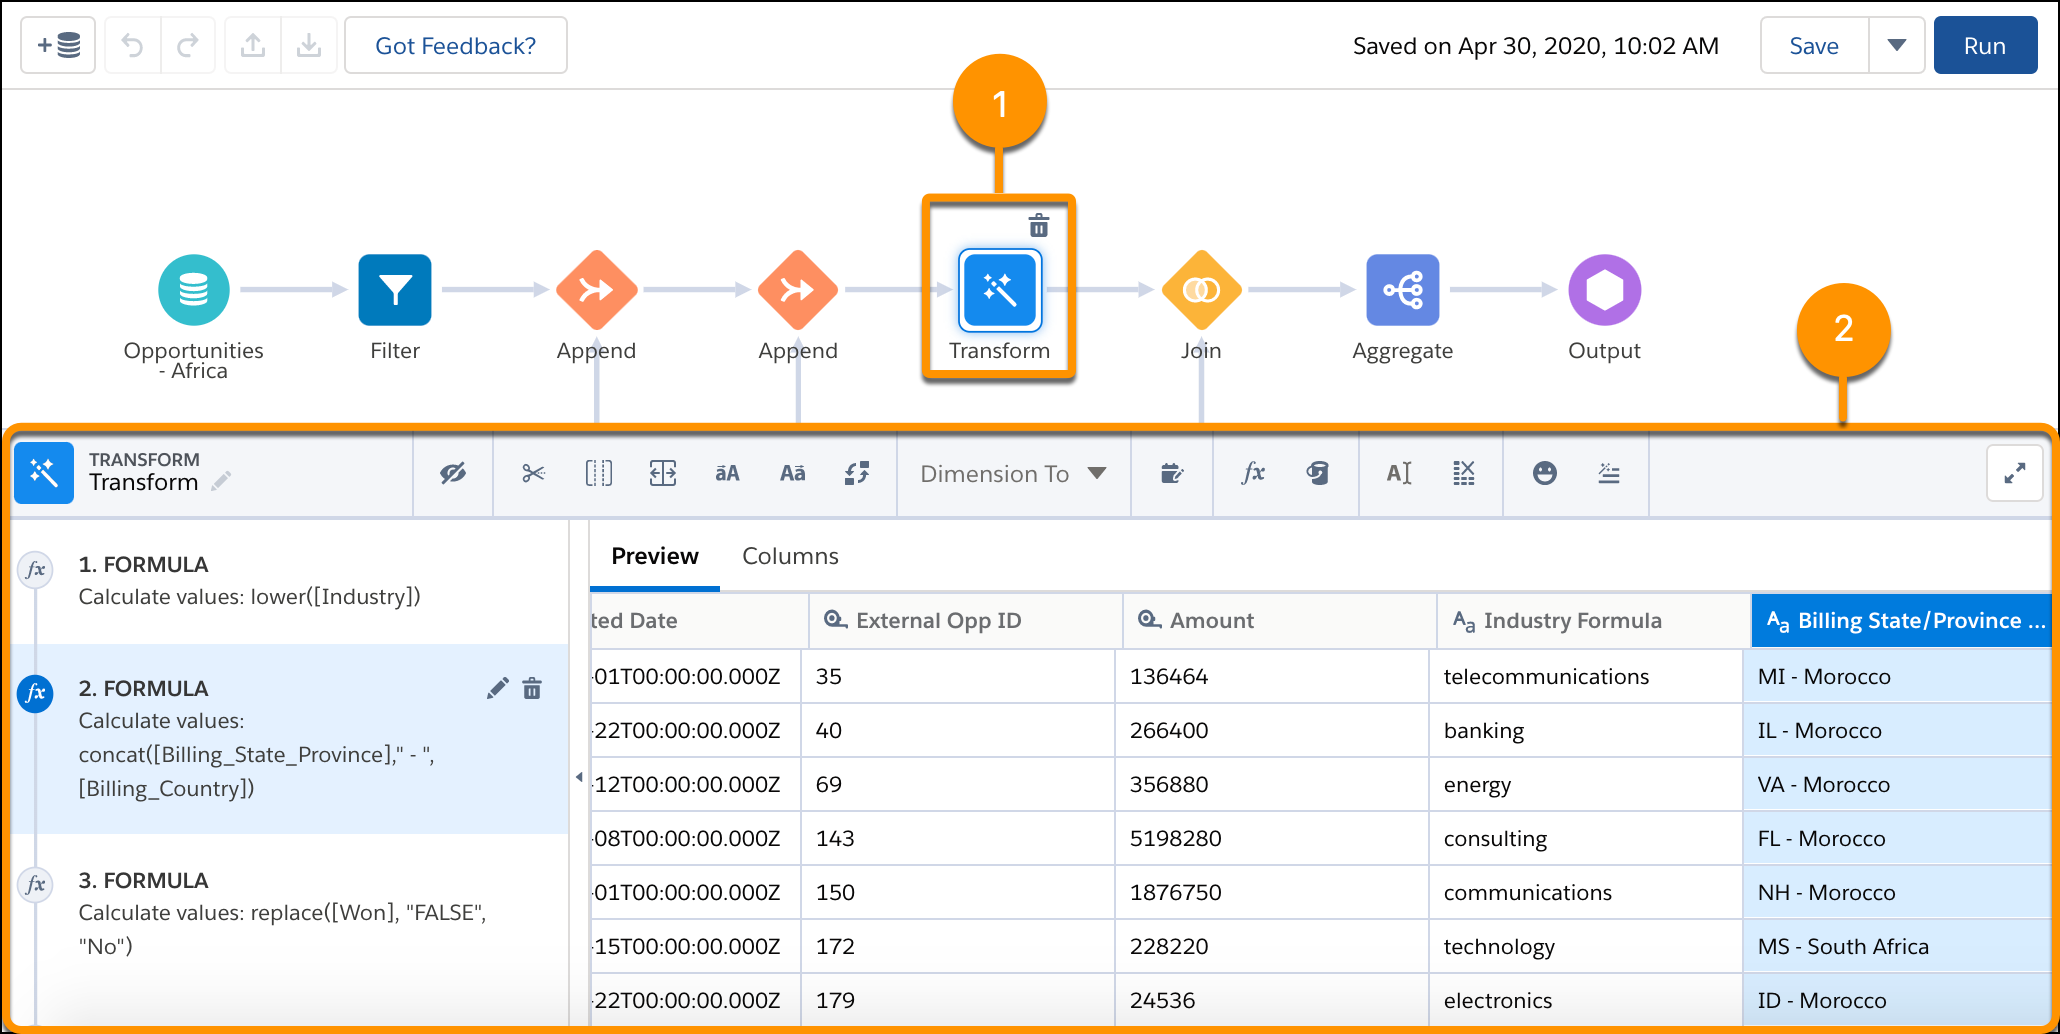
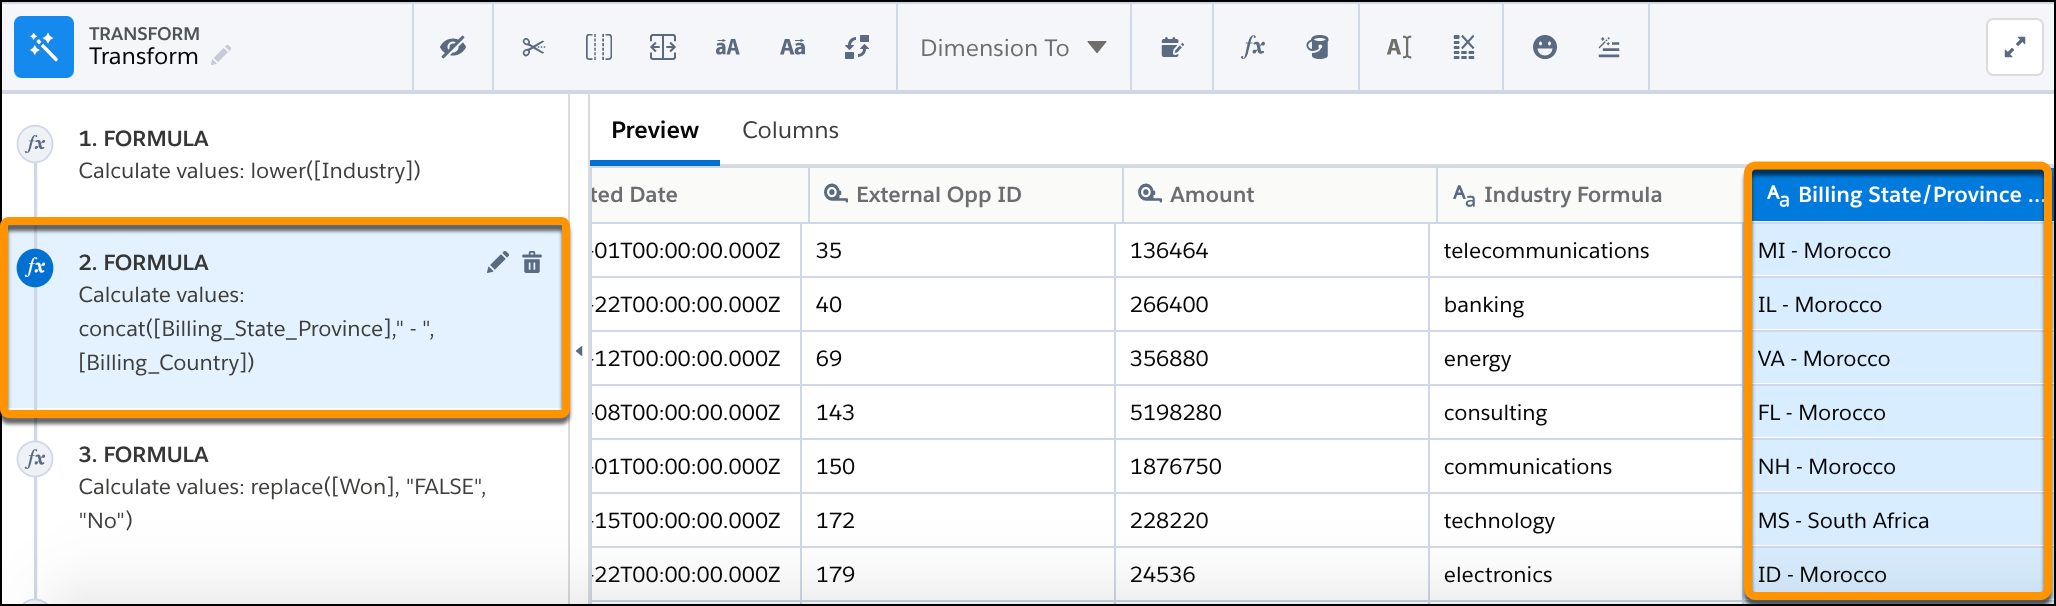
You can select a transformation step in the left panel of the Details area to preview the results of that transformation in the Preview tab. Similarly, you can select any node in the graph to preview the results of that node.
When you run a recipe, CRM Analytics applies the function of each node on the input data, and then outputs the results to the specified target. If the target is a dataset, you can then use that dataset as input to other recipes.