Loading
Salesforce now sends email only from verified domains. Read More
CRM Analytics
Table of Contents
Select Filters

          No results
          No results
          Here are some search tips

          Check the spelling of your keywords.
          Use more general search terms.
          Select fewer filters to broaden your search.

          Search all of Salesforce Help
          Aggregate and Group Data to a Different Grain

          Aggregate and Group Data to a Different Grain

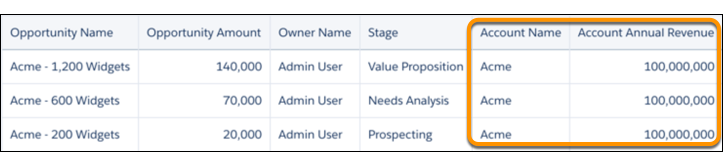
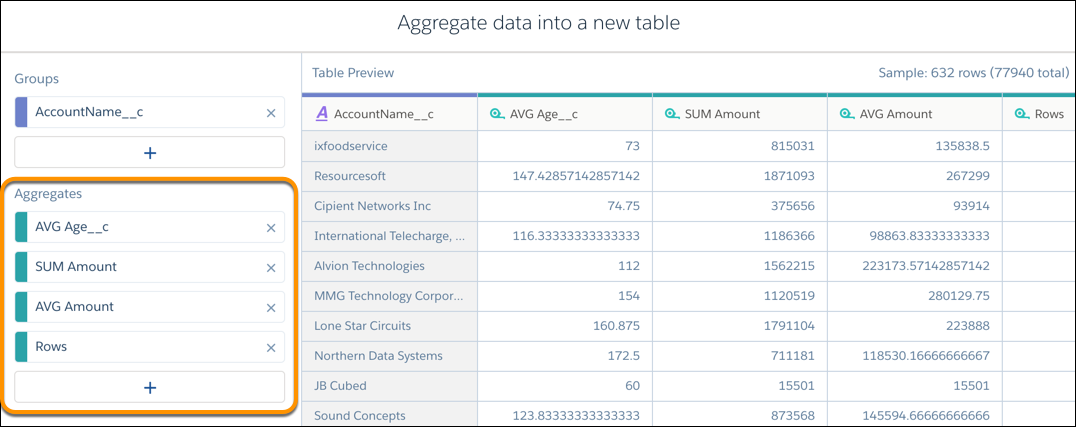
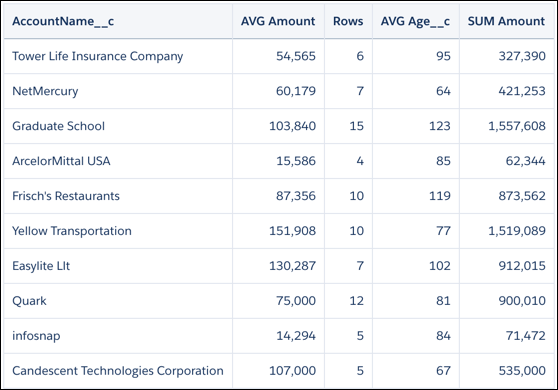
          Large datasets can be hard to digest due to the amount of information and low-grain details. Aggregation allows these datasets to be rolled up to a higher granularity, thus allowing users to create recurring summary statistics and join datasets with different granularities. You can also aggregate data to perform calculations on grouped records without aggregating the measures. For instance, group by website session IDs and then calculate the average time on each page and total number of clicks.

          Required Editions

          Available in Salesforce Classic and Lightning Experience.
          Available with CRM Analytics, which is available for an extra cost in Enterprise, Performance, and Unlimited Editions. Also available in Developer Edition.
          Note
          Note To aggregate rows in a Data Prep recipe, see Aggregate Node: Roll Up Data to a Higher Level.

          You can add groups, aggregates, or both. Group by dimensions or date windows to roll up the records to a higher grain. For example, group daily logs by month so you can join that data with your monthly datasets. Aggregate measures to the new grouping granularity. You can use the following aggregate functions on measure columns: sum, unique, avg, count, max, and min.

          Note
          Note

          To prevent double counting, exclude aggregated values that don’t match the grain of the dataset. For example, the following dataset’s grain is opportunity—each record represents an opportunity. However, the grain of the Account Annual Revenue aggregated value is account. If a user doesn’t know the dataset grain and adds all Account Annual Revenue values, he would double count annual revenue for accounts with multiple records. To prevent double counting, move Account Annual Revenue to a different dataset where the grain is account.

          The account annual revenue is listed three times--once for each of the three opportunities tied to the same ACME account.
          1. On the recipe page, click the Aggregation button (Add data button).
          2. To change the granularity of the data, add groups. For example, group by account name to aggregate metrics by this dimension.
          3. To view aggregated metrics for each grouping, add aggregates. For example, calculate the average age for opportunities to close, total amounts, average amounts, and total number of deals. Because these opportunities are grouped by account name, these aggregates provide key metrics about each account.
            Select the groups and aggregates on the left.
          4. Click Done.
            Notice that the aggregates and group-by fields are the only fields included in the output. All other fields from the source dataset are excluded—you can’t perform transforms on them in this recipe anymore.
          5. Click Save | Save Recipe.

          When you run the recipe, CRM Analytics generates a new dataset that contains the aggregates specified in the recipe and a grain determined by the groups. In the example, we see the aggregates for each account.

          The new dataset has a row for each account and shows key metrics for each.
           
          Loading
          Salesforce Help | Article