Loading
CRM Analytics
Table of Contents
Select Filters

          No results
          No results
          Here are some search tips

          Check the spelling of your keywords.
          Use more general search terms.
          Select fewer filters to broaden your search.

          Search all of Salesforce Help
          Cluster Transformation: Segment Your Data

          Cluster Transformation: Segment Your Data

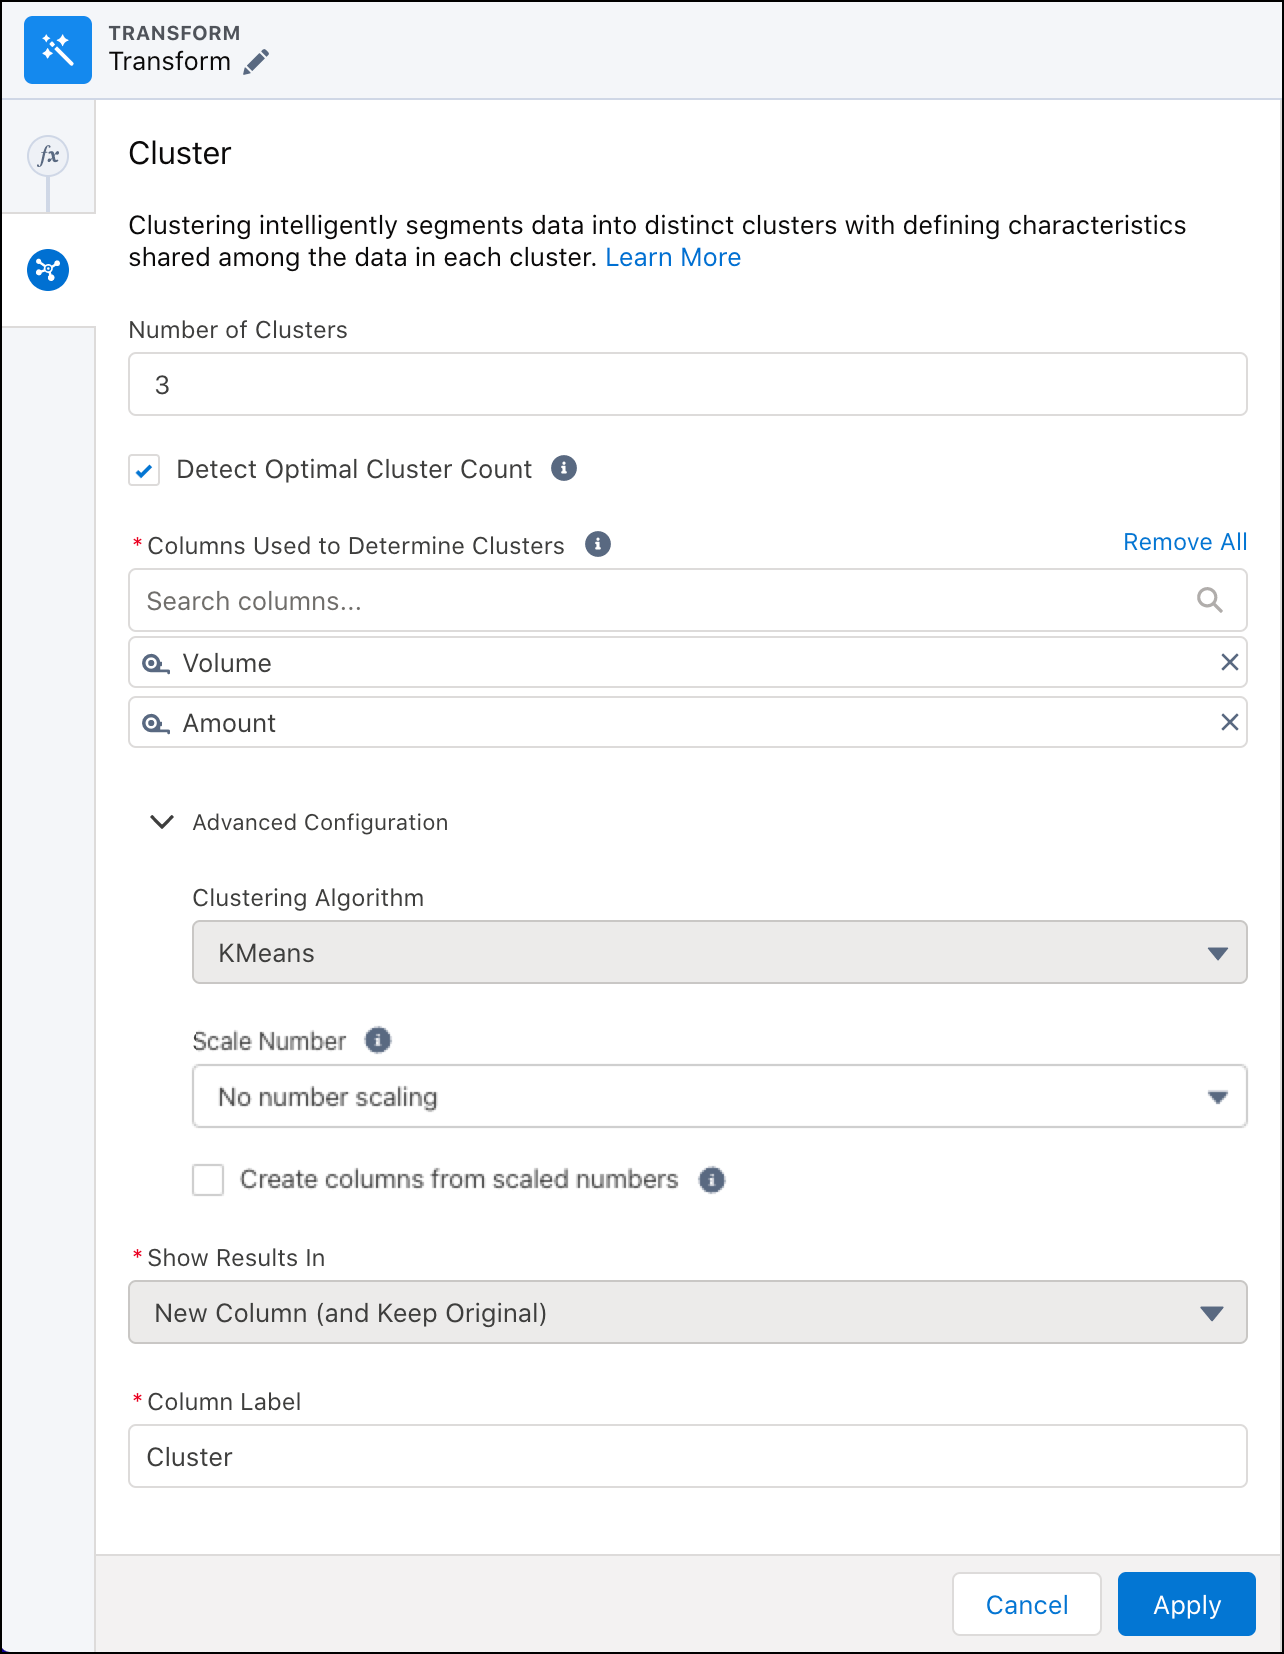
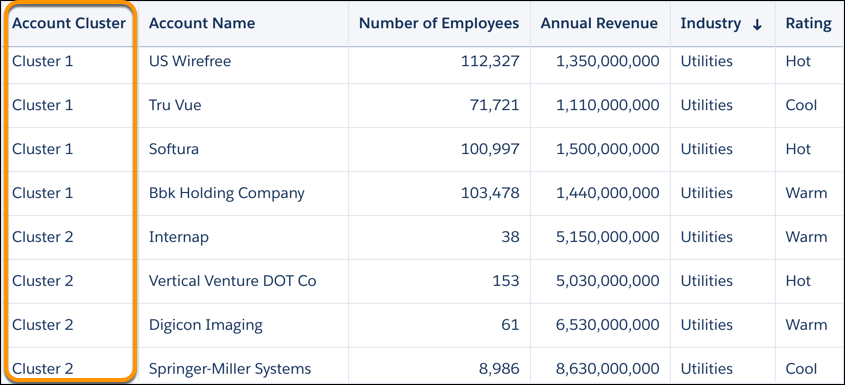
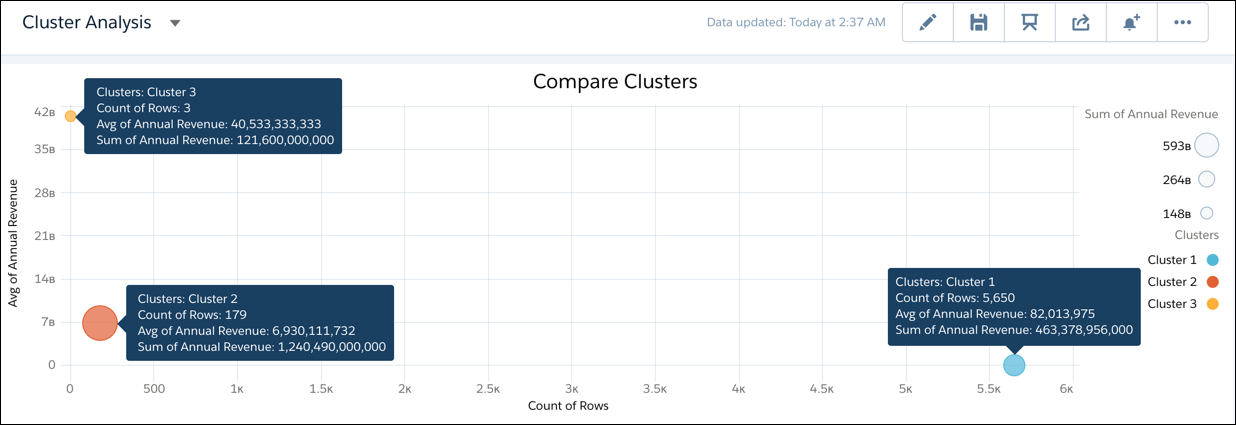
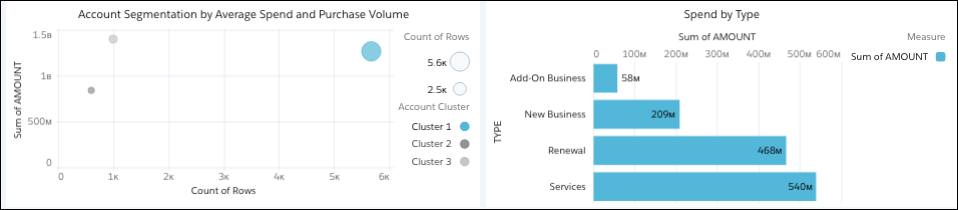
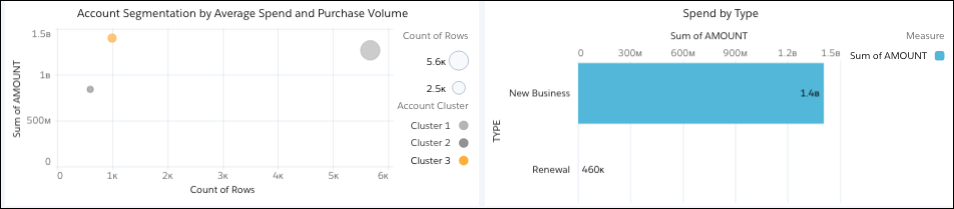
          In CRM Analytics, use the Cluster transformation in a Data Prep recipe to segment rows of data into distinct clusters based on common characteristics. For example, you can cluster accounts based on number of employees, numerical rating, and annual revenue. Using the clusters, you can identify products and services to upsell to each account based on other accounts in the same cluster, apply different service handling or marketing campaigns based on cluster, or define different metrics and KPIs for analysis.

          Required Editions

          Cluster Transformation: Segment Your Data

          User Permissions Needed
          To create a recipe: Edit CRM Analytics Dataflows OR Edit Dataset Recipes
          1. In a Transform node of a Data Prep recipe, select any column in the Preview tab.
          2. To add a Cluster transformation to the Transform node, click the Cluster button (Cluster button).
            The Cluster panel shows the configuration options.
          3. In Number of Clusters, enter the number of clusters to create, from 2–20, inclusive.
          4. Select Use optimal number of clusters and we evaluate all options 25% above and below your base Number of Clusters to find the best data organization where data groupings are most like each other.

            For example, if you enter 20, we evaluate scenarios from 15—25 and show data for the optimum number of clusters in that range. If you select to detect the optimal number of clusters without a starting point, we evaluate each clustering scenario from 2–50. This evaluation takes more time than if you enter a starting number of clusters, but it can reveal a data relationship you weren’t aware of.

          5. In Columns Used to Determine Clusters, select the text (dimension) columns to determine the clusters.

            The clustering algorithm determines clusters by comparing the values for all selected columns. For example, if the number of employees and annual revenues don’t fall into the same ranges determined by the algorithm, accounts with the same industry and rating can be placed in different clusters.

          6. Select an option under Scale Number to rescale the data. For example, comparing between differently scaled data easier by rescaling each column’s data values from 0 through 1 with the Min-Max scaling option.
          7. If needed, change the label of the cluster column, which stores the cluster for each row.
          8. To add the transformation to the Transform node, click Apply.

            Preview shows sample cluster values you can use when building other recipe transformations. These values are just samples—they can change after the recipe runs.

          9. To view the Graph area, click the Collapse button (Collapse button).
          10. Save the recipe.
          11. Run the recipe to assign and view a cluster for each row.

            To process billions of rows, the Cluster transformation uses the K-Means clustering algorithm. The clusters are detected dynamically during the recipe job’s runtime, but aren’t persisted. The clusters can change between recipe runs even if the data and the clustering configuration doesn’t change.

          Example
          Example

          For months, you’ve noticed that some accounts have lots of deals with lower average opportunity amounts and other accounts that have larger deals, but fewer of them. To find ways to drive larger deal sizes and more deals, you decide to cluster your accounts.

          You use the Cluster transformation to create three clusters based on the account industry, number of employees, rating, and annual revenue.

          The Account Cluster column shows the cluster for each acccount.

          While analyzing the clusters in a dashboard, you notice that Cluster 3 has the highest average annual revenue (about $40 billion), but only three accounts are in that cluster.

          The dashboard shows dot and key information about each cluster.

          Why doesn’t Cluster 3 have more deals? Is it due to repeat business? Let’s find out.

          Use the Aggregate node to group total spend by account and pivot the results by opportunity type: Add-On Business, New Business, Renewal, and Services.

          The Aggregate node pivots Opportunity Type to show account spend for each type.

          Looking at spend by opportunity type for Cluster 2, we see lots of repeat business. Great!

          The dashboard shows that Cluster 2 has lots of repeat business.

          But Cluster 3 has new business only. These accounts buy one time and don’t return for additional business—hence the lower number of deals.

          The dashboard shows that Cluster 3 hardly has any repeat business.

          We found gold! To increase the number of deals from Cluster 3 accounts, we can push renewals, services, and add-on business.

           
          Loading
          Salesforce Help | Article