You are here:
Time Series Forecasting Transformation: Forecast Measures
In CRM Analytic, make decisions today based on forecasts about tomorrow with time series forecasting. A time series forecast takes an ordered series of points and intelligently forecasts the next values. For example, estimate units sold for the next 4 quarters based on the last 5 years of sales. Use the Time Series Forecasting transformation in a Data Prep recipe to run forecasts based on historical data and seasonality.
Required Editions
Time Series Forecasting Transformation: Forecast Measures
| User Permissions Needed | |
|---|---|
| To create a recipe: | Edit CRM Analytics Dataflows OR Edit Dataset Recipes |
- In a Transform node of a Data Prep recipe, use the toolbar to click the Time Series
Forecast button (
 ).
). 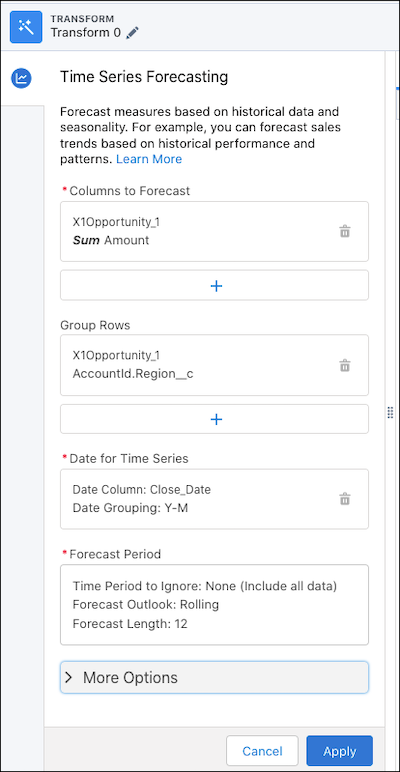
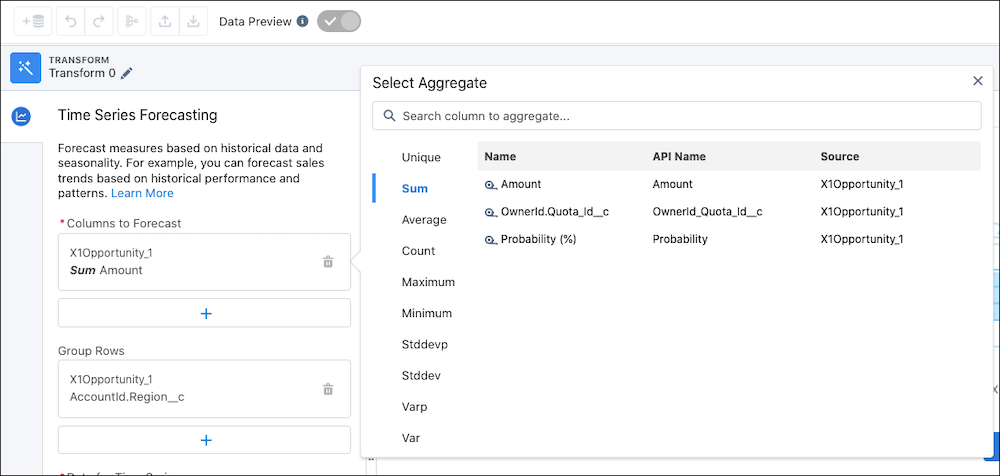
- In Columns to Forecast, select which columns to aggregate and forecast.
For example, sum and forecast opportunity Amount. You can also aggregate unique values of text (dimension) and dates. For example, forecast count of unique Account Name.
- Optionally, in Group Rows, select groups to forecast by. For example, forecast by region.
- In Date for Time Series, select a date column and a date grouping. For example, Close Date year-month.
- In Forecast Period, specify your forecast outlook.
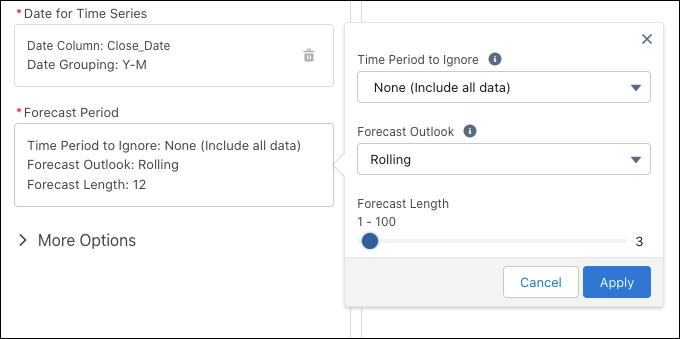
Forecast Period Fields Description Time Period to Ignore Choose what happens when data is incomplete, such as ignore a time period with only partial data. For example, ignore the last time period when forecasting by month while data for the current month is still being collected so it doesn’t influence your forecast. Incomplete data can lead to a misleading forecast.
- None (Include all data) uses all data available.
- Last Time Period uses data up to—but not including—the last time period.
Forecast Outlook Rolling sets forecast length starting at recipe run date, such as rolling 3 months.
Forecast Length Specify length of forecast from recipe run date. Forecast length is the number of future time periods you want to forecast for.
For example, if date grouping is year-month, then a rolling forecast length of 3 represents the next 3 months. If date grouping is year, then a rolling forecast length of 3 represents the next 3 years.
More data is predicted if there’s a gap between the dataset’s most recent date and the current period. For example, if your data isn’t updated for two months and you’re forecasting out 3 months, then 5 months of data is predicted. Say your data hasn’t been updated since October and it’s now December, and you’re forecasting out 3 months, then you’ll get a forecast until March of next year.
- Optionally, use More Options to further modify the time series forecast.
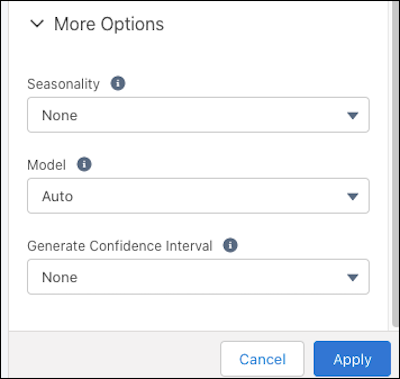
Options Description Seasonality Periodic fluctuations that occur around the same time every year.
- For example, if sales fluctuate quarterly, select 4 (quarters in a year) and use a date grouping of year-quarter.
- Choose Auto so Data Prep determines the best seasonality for you.
- Choose None if seasonality doesn’t apply.
Model Model used to forecast values.
You can use one of these models.
- Additive uses Holt-Winters Additive method. Use this method when the seasonal variations are roughly constant throughout the series.
- Multiplicative uses Holt-Winters Multiplicative method. Use this method when the seasonal variations change proportionally to the average (level of the series).
- Auto selects the most accurate forecast method.
Generate Confidence Interval To account for errors in forecasts, select an 80% or a 95% confidence interval.
A confidence interval provides a range of values for each forecast based on a certain level of confidence — the higher the confidence level, the wider the range.
Creates two columns for the low and high values of the confidence interval. For example, the column names for a 95% confidence interval are column_name (Low 95) and column_name (High 95).
- To add the transformation to the Transform node, click Apply.
- To view the Graph area, click the Collapse button (
 ).
). - Save the recipe.
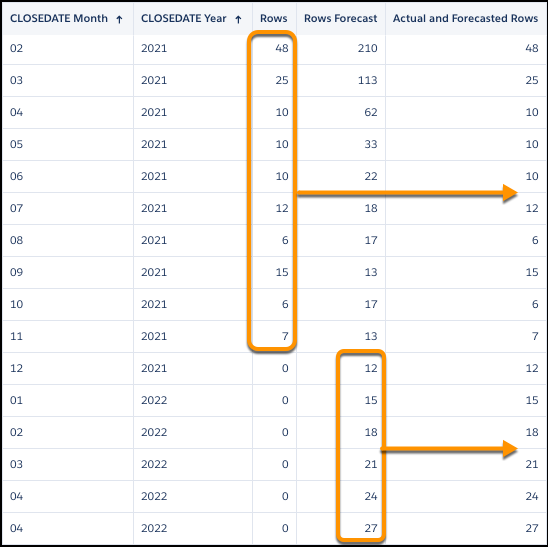
Run the recipe to see forecasts. Each forecast column shows the results for every time period, including the historical ones. For example, the Rows Forecast and the Sum of Amount Forecast columns show the forecasts. To combine the forecasts for future periods with the historical values in a column, use a Coalesce formula for each number (measure)—similar to this one.
coalesce(COUNT_Rows, COUNT_Rows_forecast)The historical values and forecasts appear in a column.