
You are here:
Change the Chart Type
Switch between chart types to see which visualization options tell the most compelling story for your data.
-
While viewing data in a lens, tap
 View.
A gallery of chart types appears. You can slide the lower portion of the window up to see more chart types, and down to see your chart.
View.
A gallery of chart types appears. You can slide the lower portion of the window up to see more chart types, and down to see your chart.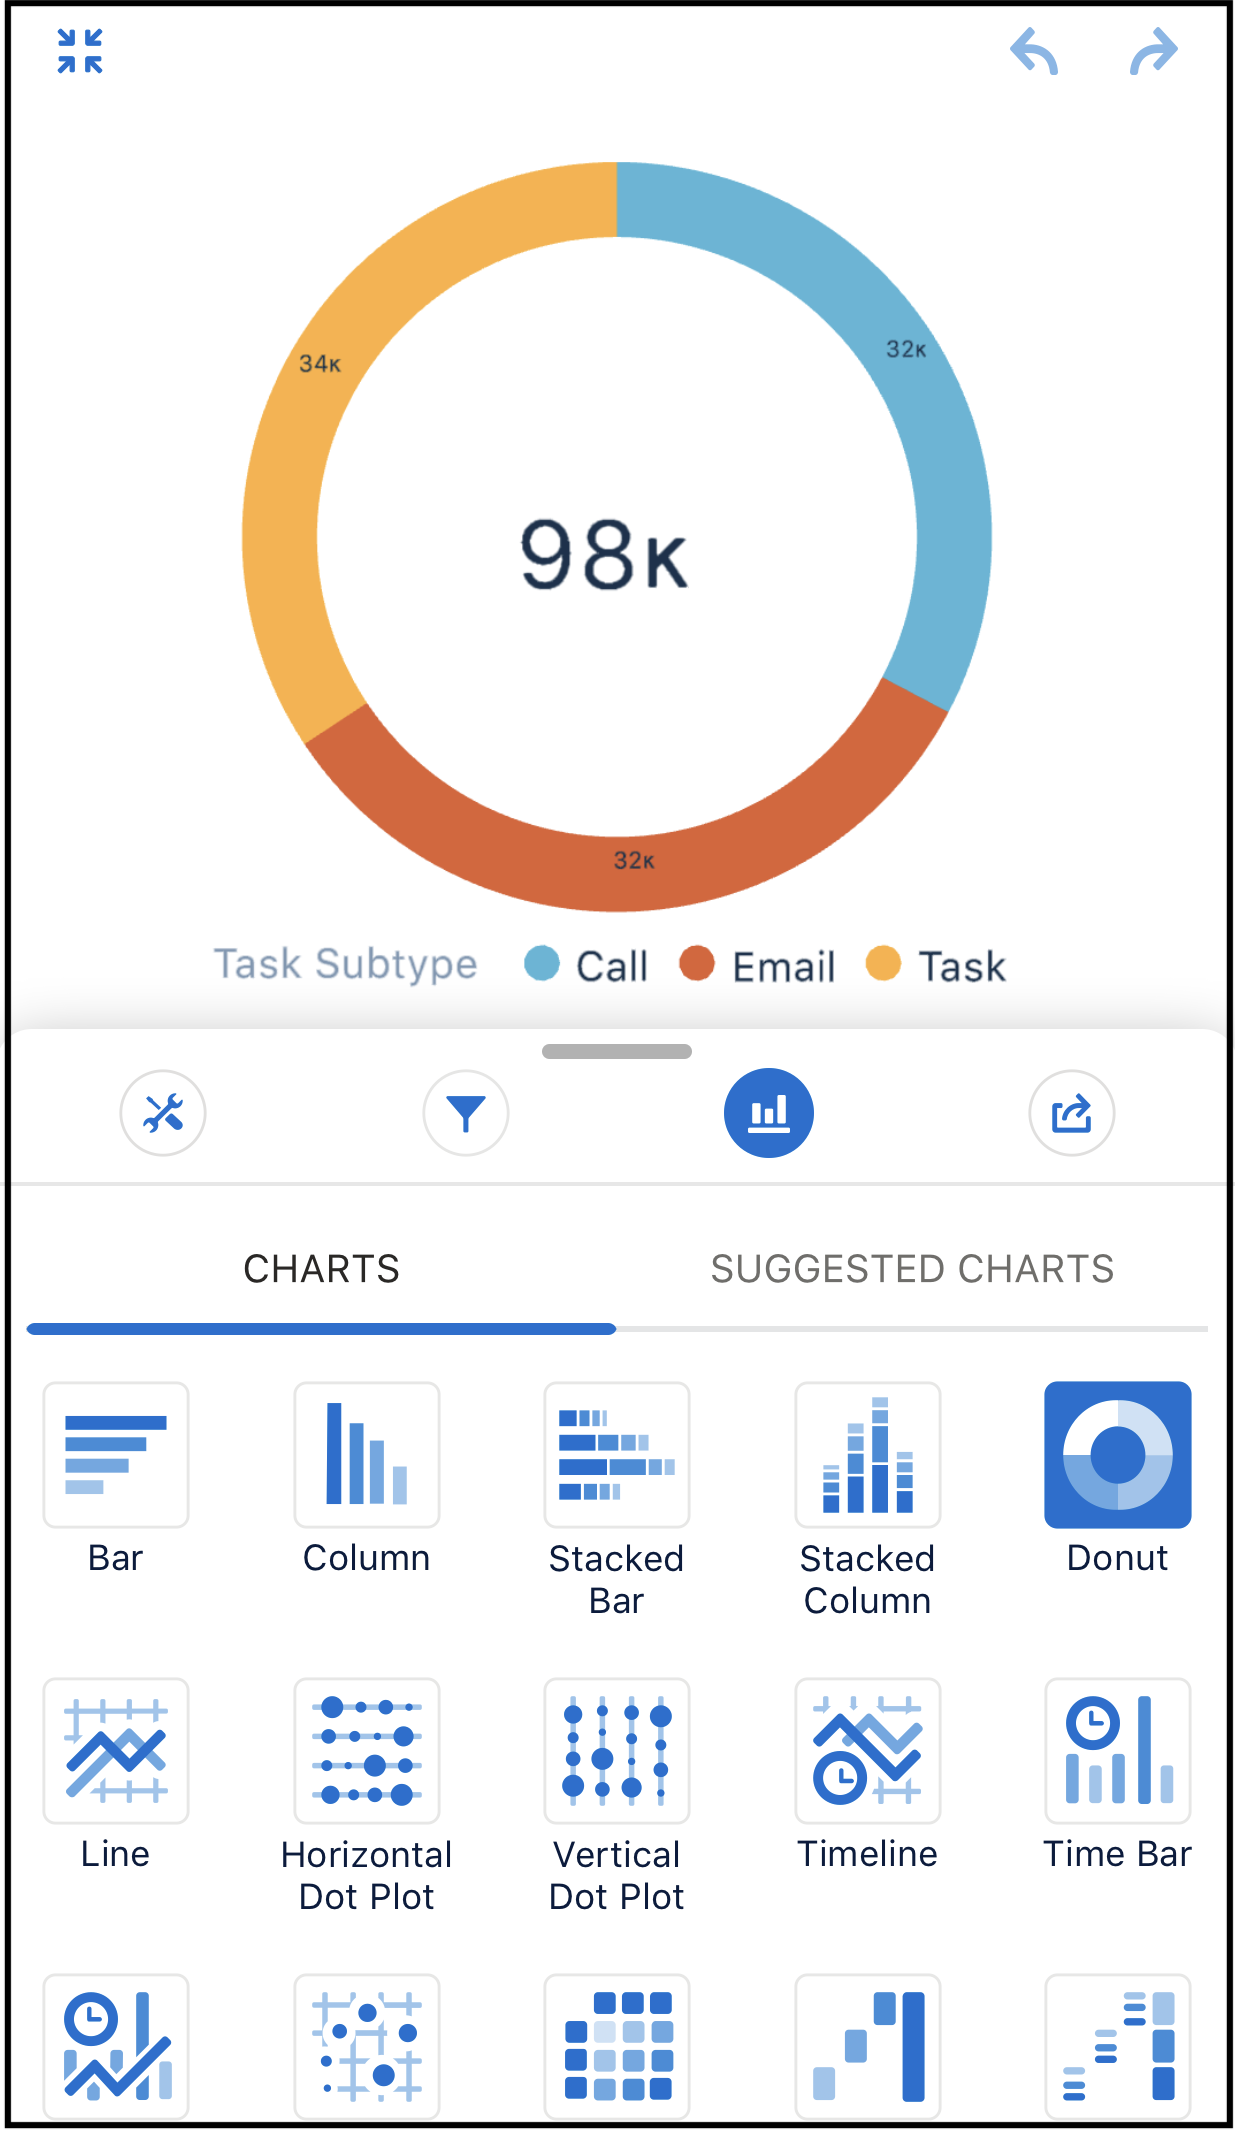
-
Select a chart type.
The chart visualization changes to match your selection.
Did this article solve your issue?
Let us know so we can improve!