
You are here:
View Your Data in a Lens
When you look at data in an exploratory mode, you do so in a lens. A lens has several aspects: it’s how you view data in a dataset, it’s the place where you explore the data graphically, and it’s the basis for building any dashboard.
-
You can continue exploring data in a saved lens or start exploring data in a new lens.
-
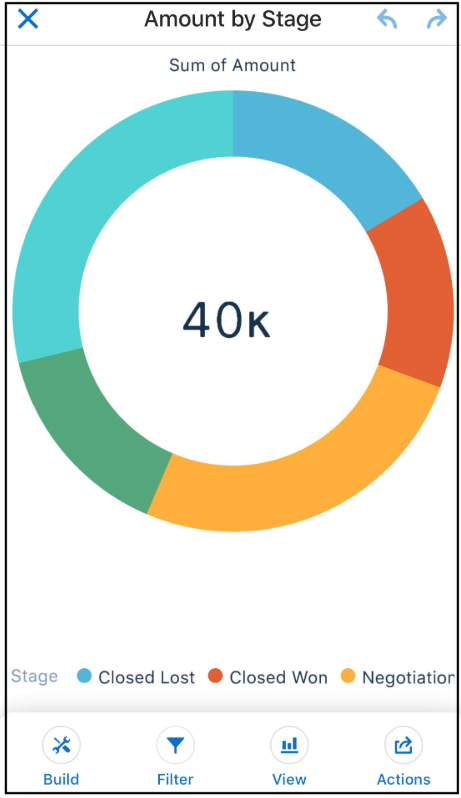
To continue exploring data in a saved lens, tap Lenses, and then select a lens.
The lens opens and shows data that might have applied measures, groupings, filters, and chart types.
-
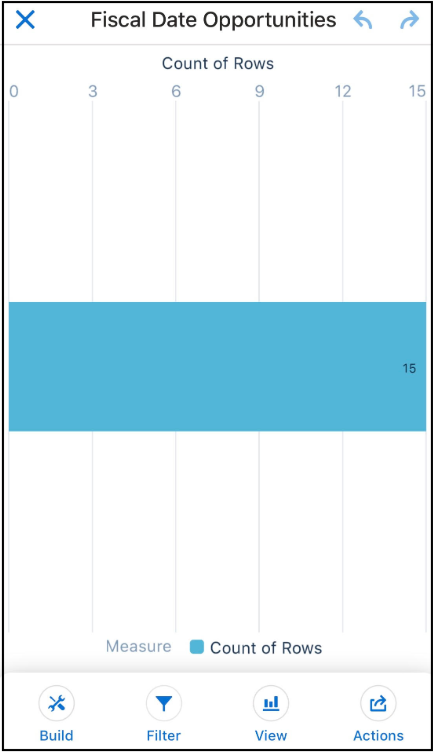
To start exploring data in a new lens, tap Datasets, and then
select a dataset.
A new lens opens and shows the dataset’s total count of rows.
-
To continue exploring data in a saved lens, tap Lenses, and then select a lens.
-
Explore by tapping
 Build and adding measures and groupings.
- Group Your Data into Categories
Group data to organize it so that the data is displayed in useful categories. - Change Measures
Your choice of measure defines your entire visualization and determines the overall scope of your exploration. - Change the Sort Order
Choose whether data in your chart visualization is sorted ascending, sorted descending, or unsorted. - Change the Chart Type
Switch between chart types to see which visualization options tell the most compelling story for your data.
Did this article solve your issue?
Let us know so we can improve!