
You are here:
Answer Ad Hoc Questions with CRM Analytics Lenses
Dashboards are great for answering common questions, but sometimes you don’t have a question in mind. You want to poke around your data and ask questions as you notice things. To explore your data, open a dataset and create ad hoc queries. To revisit the query later, save it as a lens. The lens includes the query and the visualization—how the results appear. Like dashboards, lenses can be shared.
When you open a dataset, the lens shows the number of dataset rows as a bar chart, by default.
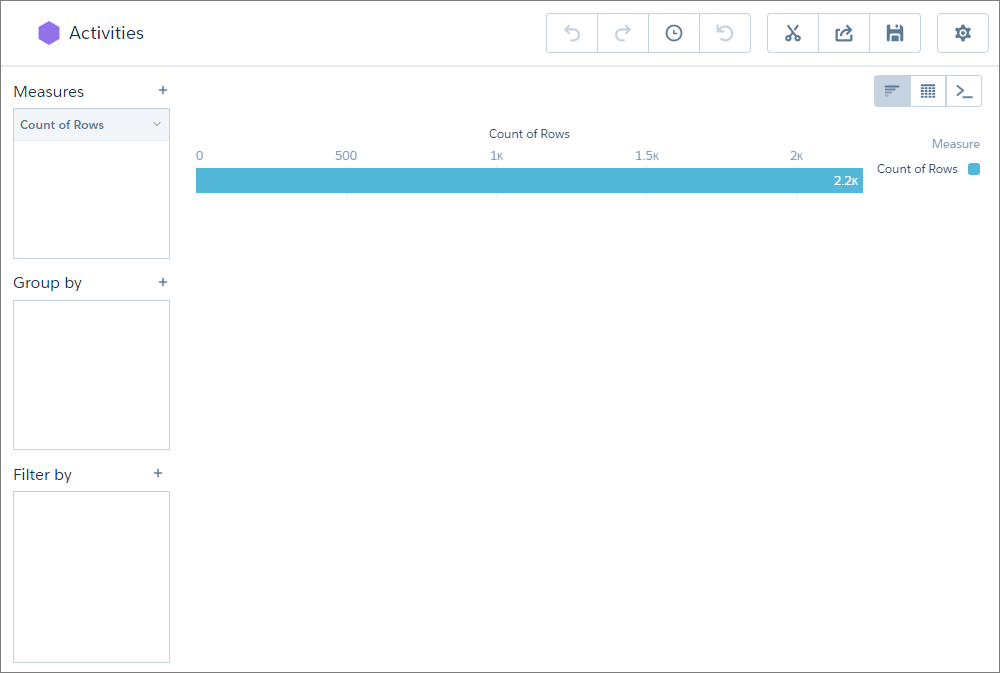
To change the query, add measures, groupings, and filters to the Measures, Group by, and
Filter by boxes. To represent the results as a different chart type, click  . To represent
the results as a table or to create calculated fields based on existing fields, click
. To represent
the results as a table or to create calculated fields based on existing fields, click
 . If
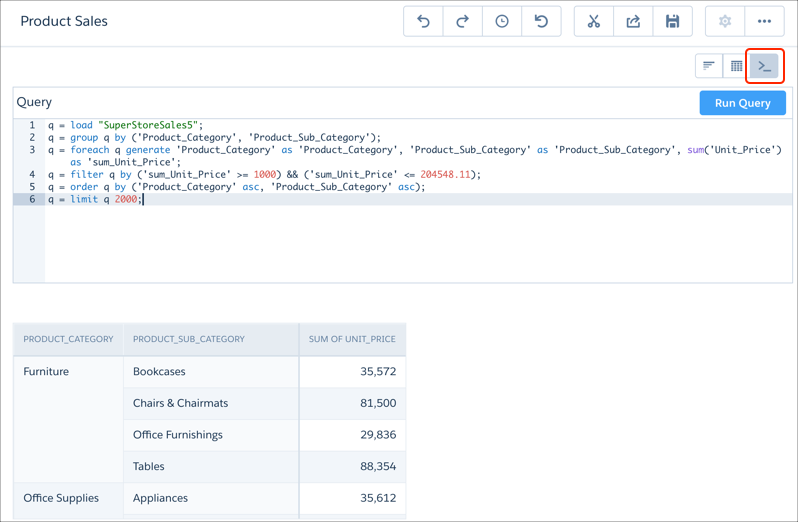
you’re more advanced and want a more robust way to create SAQL queries, click
. If
you’re more advanced and want a more robust way to create SAQL queries, click  to manually
enter the query.
to manually
enter the query.
To add a query to a dashboard, click ![]() to clip it.
to clip it.