
You are here:
Query Your Data to Know Your Business
It’s great to have a gut feeling about how well your business is doing. However, before you take action, test the feeling against your data. Ask your data questions.
The easiest method for asking questions about data in datasets is to explore it in a lens. You ask questions in the form of queries. Use the left panel (1) of the lens to create your query. You can perform calculations (referred to as measures), like sum of amount or average case duration. To break down the measure across different areas, group it by descriptive fields (known as dimensions), like region or owner. To find the top or bottom performers, sort the measure in descending or ascending order. Then, if needed, apply filters to focus on a subset of the results.
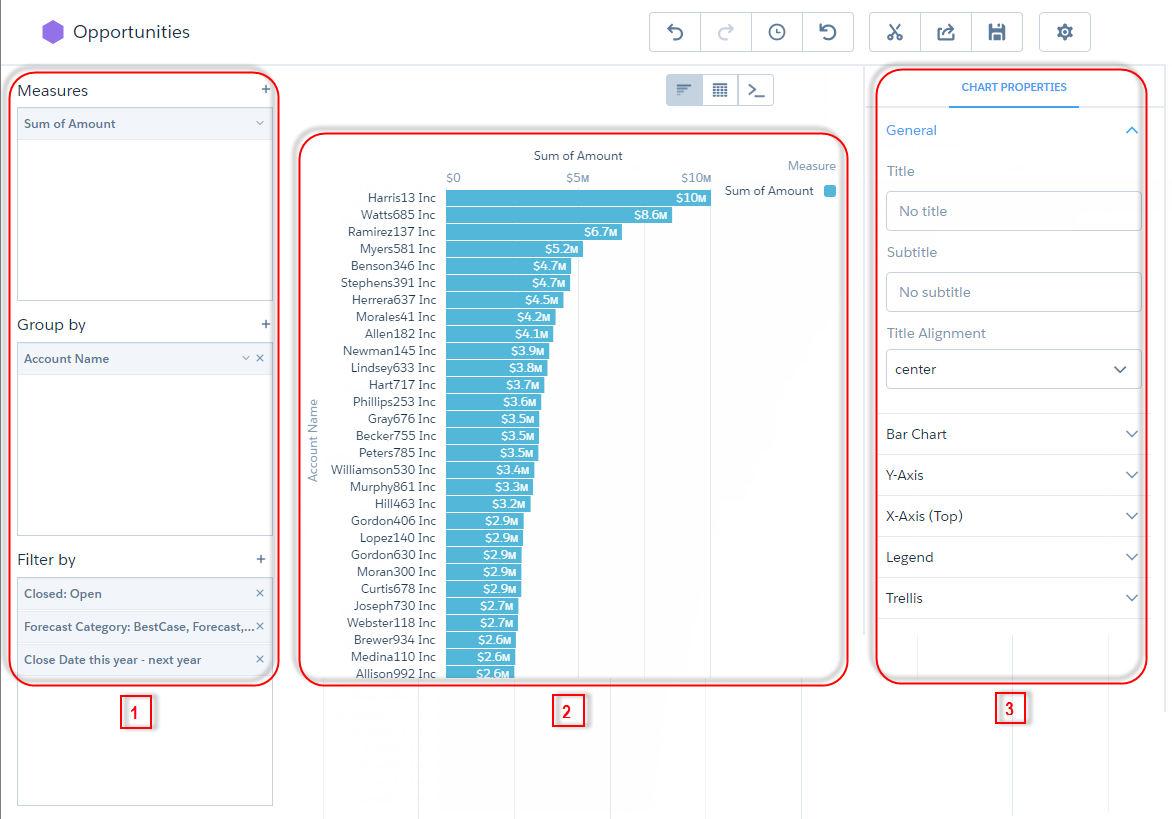
The middle panel (2) shows a visual representation of the query results. You can display
the results as a chart or table. When in chart mode ( ), you can
choose which chart type to use—CRM Analytics offers many. In table mode (
), you can
choose which chart type to use—CRM Analytics offers many. In table mode ( ), you can
display the dataset records as a values table or create calculated fields and display
them in a compare table. And, yes, pivot tables are also possible.
), you can
display the dataset records as a values table or create calculated fields and display
them in a compare table. And, yes, pivot tables are also possible.
The right panel (3) shows the visualization properties—configure them to modify
the appearance of the chart or table. For instance, you can remove the legend, change
the axis scale, or add a title. To view this panel, click  .
.
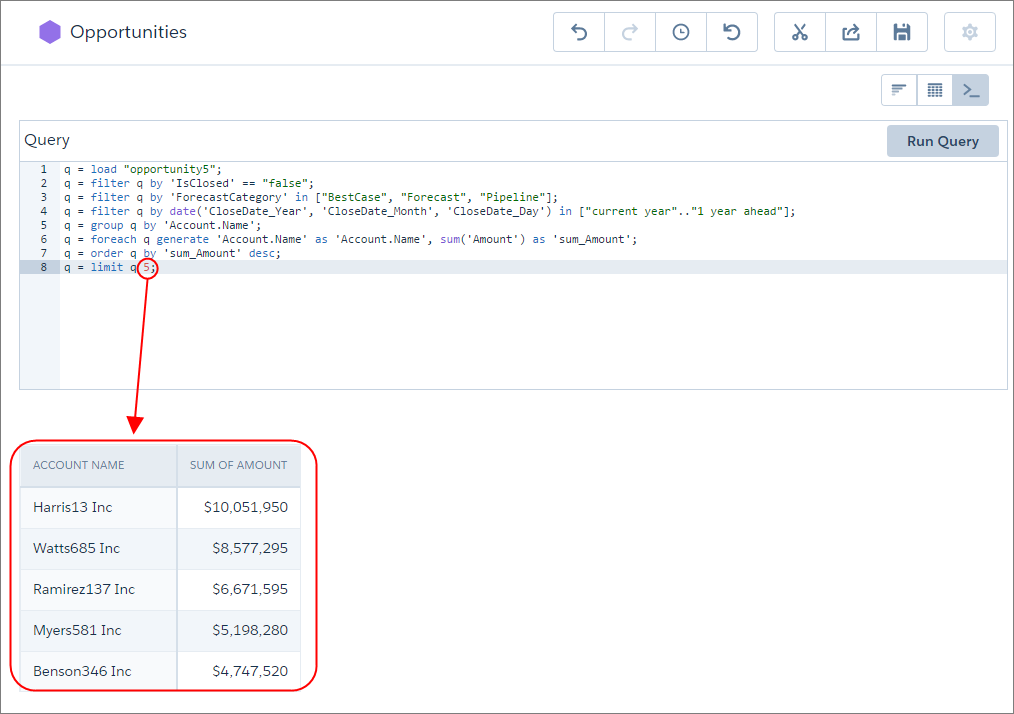
If you’re more advanced, write your own custom queries using Salesforce Analytics Query
Language (SAQL) notation. In SAQL mode ( ), you have more
flexibility to write robust queries, like ones that span multiple datasets or have
modified query limits. For example, if the results are sorted in descending order, you
set the limit to 5, and click Run Query, the query returns only
the top five accounts.
), you have more
flexibility to write robust queries, like ones that span multiple datasets or have
modified query limits. For example, if the results are sorted in descending order, you
set the limit to 5, and click Run Query, the query returns only
the top five accounts.
- Monitor Your Business Regularly with CRM Analytics Dashboards
CRM Analytics dashboards are populated with your data based on queries that you define. To continually get answers to common questions, save and organize your queries in interactive CRM Analytics dashboards. Each time you open the dashboard, the queries get the latest results based on the available data. - Answer Ad Hoc Questions with CRM Analytics Lenses
Dashboards are great for answering common questions, but sometimes you don’t have a question in mind. You want to poke around your data and ask questions as you notice things. To explore your data, open a dataset and create ad hoc queries. To revisit the query later, save it as a lens. The lens includes the query and the visualization—how the results appear. Like dashboards, lenses can be shared.