You are here:
Monitor Your Business Regularly with CRM Analytics Dashboards
CRM Analytics dashboards are populated with your data based on queries that you define. To continually get answers to common questions, save and organize your queries in interactive CRM Analytics dashboards. Each time you open the dashboard, the queries get the latest results based on the available data.
As the sales executive, the start of your day might include a cup of coffee and the following sales leader dashboard. Each component is based on a query. For example, the timeline chart component shows the cumulative opportunity amount for each week of this quarter. The leaderboard in the left column ranks reps by sales (closed won opportunities).
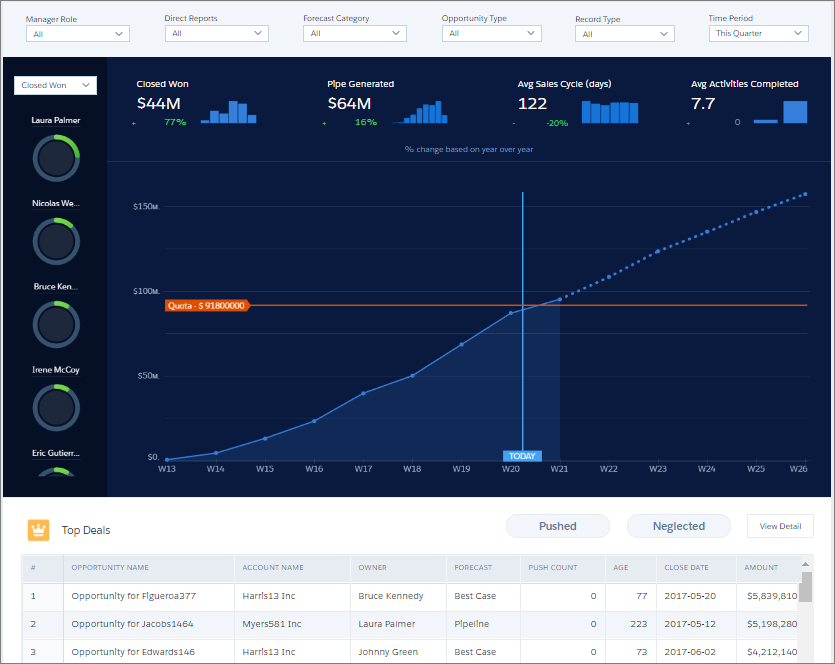
Because of built-in dashboard interactivity, you don’t have to add more queries to ask follow-up questions. For example, to focus on an individual’s performance, select the rep’s donut chart in the leader panel on the left. CRM Analytics filters the dashboard results based on the selected rep. Behind the scenes, CRM Analytics modifies the underlying queries, filtering the results to get the specific rep’s opportunities.
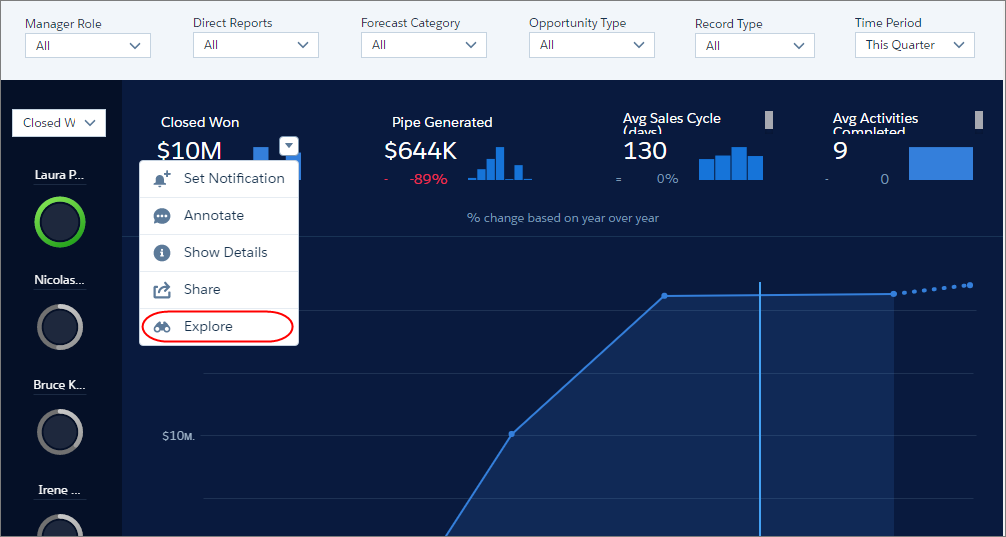
If the dashboard can’t be used to answer a question, hover over a dashboard component and click Explore to create a new query based on the same dataset.