
You are here:
Account Insights Embedded Dashboard
The Account Insights embedded dashboard allows you to embed your account information anywhere so that it’s accessible at-a-glance. This dashboard provides information about opportunities, quotes, and orders for an account so you can optimize selling.
Required Editions
| Available in: Developer edition and for an extra cost in Enterprise, Performance, and Unlimited editions. |
Embed the Account Insights Dashboard
You can embed and access the Account Insights dashboard in Lightning Experience pages and Salesforce Classic experiences.
The Account Insights dashboard requires filters to be added when embedding it. Use the
following syntax: {"datasets":{"Quote":[{"fields":["AccountId"],"filter":{"operator":"in","values":["$Id"]},"locked":true,"hidden":true}],"Order":[{"fields":["AccountId"],"filter":{"operator":"in","values":["$Id"]},"locked":true,"hidden":true}],"Opportunity":[{"fields":["AccountId"],"filter":{"operator":"in","values":["$Id"]},"locked":true,"hidden":true}]}}
For general instructions on embedding dashboards, see Embed Dashboards Everywhere in Salesforce Help.
For instructions on filtering embedded dashboards, see Filter and Selection Syntax for Embedded Dashboards in Salesforce Help.
Understand Your Account Opportunities
| Section | Description |
|---|---|
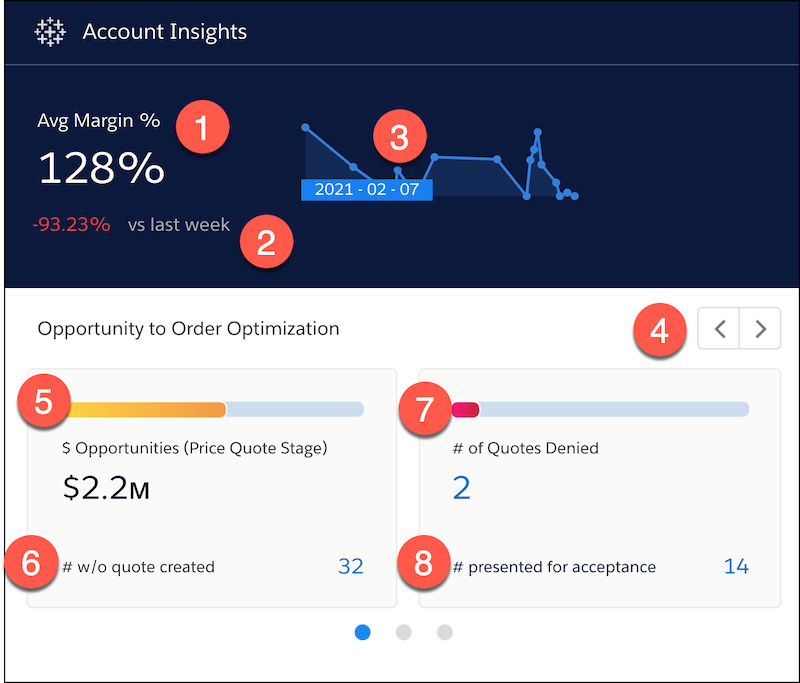
| ( 1.) Avg Margin | The average margin for current quotes. |
| ( 2.) vs last week | This week’s average margin vs. last week’s average margin. Use this metric to see if your margins are trending up or down. |
| ( 3.) | Quotes over time with the margin for each quote. Hover over points on the graph to see the details for each quote’s creation date and average quote margin total. |
( 4.)  |
See more details about quotes and orders by navigating left or right. |
| ( 5.) Opportunities (Price Quote Stage) | The total opportunity. To see what percentage of the total opportunity has quotes, hover over the bar graph. |
| ( 6.) # w/o quotes created | The number of opportunities without quotes created. To see a detailed chart that includes the name of the opportunity and the amount (in dollars), hover over the number. |
| ( 7.) # of Quotes Denied | The number of quotes denied. To see the percent of quotes denied, hover over the bar graph. To see a detailed list of the denied quotes, hover over the number. |
| ( 8.) # presented for acceptance | The number of quotes presented for acceptance. To see a detailed table of quotes presented for acceptance, including the quote margin total and the effective quote total, hover over the number. |
KPI Calculations
- Average Margin %: Avg of vlocity_cmt__QuoteMarginTotal__c.
- Margin trending Chart: Avg of vlocity_cmt__QuoteMarginTotal__c by CreatedDate.
- % Opp with Quotes: Sum of OppsWithQuotes / TotalOpps as %.
- $ Opportunities (Price Quote Stage): Sum of Amount.
- # w/out quote created: Count of Rows.
- % of quotes denied: Sum of QuotesDenied / TotalQuotes as %.
- # of quotes denied: Count of rows.
- # presented for acceptance: Count of rows.
Understand Your Account Quotes
| Section | Description |
|---|---|
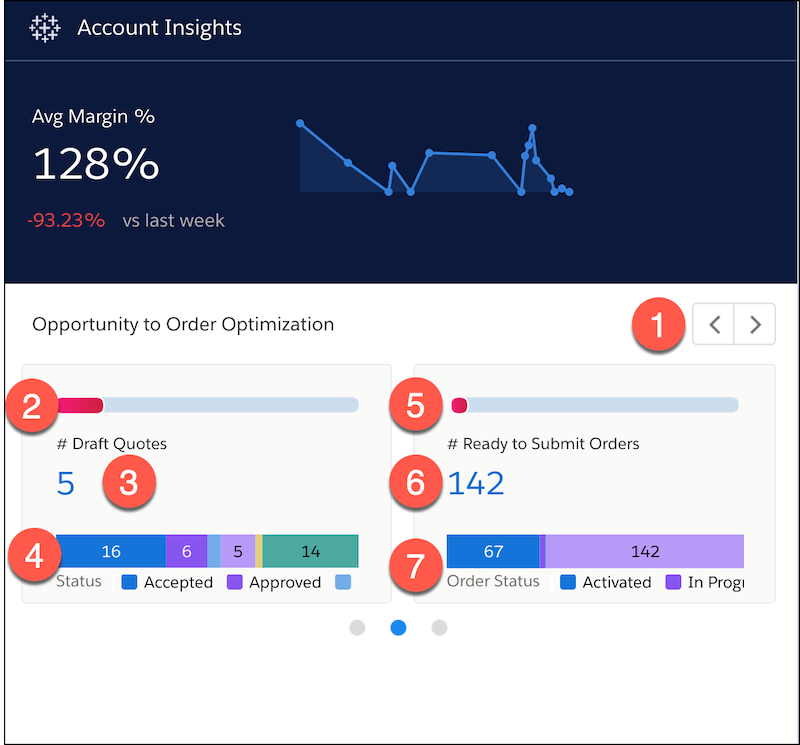
| ( 1.)
|
To see more details about the account opportunities and orders, navigate left or right. |
| ( 2.) | To see the percent of quotes in draft, hover over the bar graph. |
| ( 3.) #Draft Quotes | Quotes that have been accepted and are ready to submit. To see the list of quotes, including the days to quote and effective quote total, hover over the number. |
| ( 4.) | The chart shows the number of quotes in the following states:
|
| ( 5.) | To see the percent of orders in draft, hover over the bar graph. |
| ( 6.) # Ready to submit orders | To see the order number and amounts, hover over the number. |
| ( 7.) | The chart shows the number of orders in the following states:
|
KPI Calculations
- % of quotes in draft: Sum of DraftQuotes / TotalQuotes as %.
- # Draft Quotes: Count of rows.
- Quotes by status chart: Quotes by Status.
- % orders in draft: Sum of DraftOrders / TotalOrders as %.
- # Ready to Submit Orders: Count of rows.
- Orders by status chart: Count of Orders by vlocity_cmt__OrderStatus__c.
Understand Your Account Orders
| Section | Description |
|---|---|
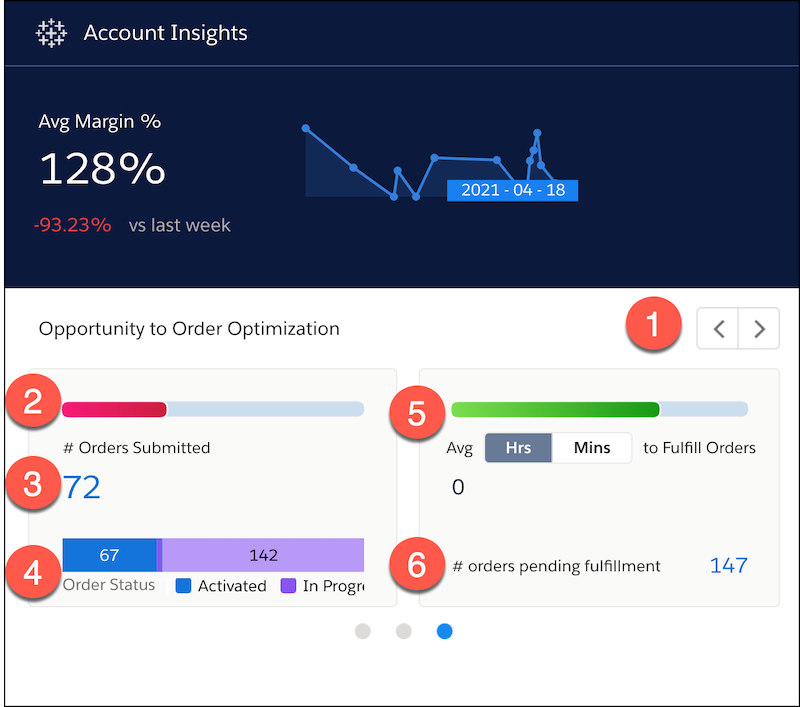
| ( 1.) |
To see more details about the account opportunities and quotes, navigate left or right. |
| ( 2.) # Orders Submitted | To see the percentage of orders submitted, hover over the bar graph. Use this metric to determine which orders to follow up on. |
| ( 3.) | To see a table of the submitted orders, hover over the number. |
| ( 4.) | View the states of your orders using this bar graph. You can see the number of orders in different states. |
| ( 5.) | To see the percent of orders pending fulfillment, hover over the bar graph. You can view the average in minutes or hours. |
| ( 6.) # orders pending fulfillment | The number of orders pending fulfillment. You can see the orders that need follow-up to determine why they aren’t yet fulfilled. To display the list of orders pending fulfillment, hover over the number. |
KPI Calculations
- % orders submitted: Sum of OrderSubmitted / TotalOrders as %.
- # orders submitted: Count of rows.
- orders by order status chart: Count of Orders by vlocity_cmt__OrderStatus__c.
- % orders pending fulfillment: Sum of OrdersPendingFulfillment / Total Orders as %.
- Avg Hours/Minutes to fulfill order: ActivatedDate - vlocity_cmt__SubmittedToOmDate__c.
- # orders pending fulfillment: Count of rows.