
You are here:
Home Embedded Dashboard
The Home Embedded dashboard helps you stay on top of the details of your communications sales processes. The app brings insights to these processes with a comprehensive dashboard that shows details about opportunities, quotes, and orders.
Required Editions
| Available in: Developer edition and for an extra cost in Enterprise, Performance, and Unlimited editions. |
Embed the Home Dashboard
You can embed and access the Home dashboard in Lightning Experience pages and Salesforce Classic experiences.
For general instructions on embedding dashboards, see Embed Dashboards Everywhere in Salesforce Help.
For instructions on filtering embedded dashboards, see Filter and Selection Syntax for Embedded Dashboards in Salesforce Help.
Navigate the Dashboard
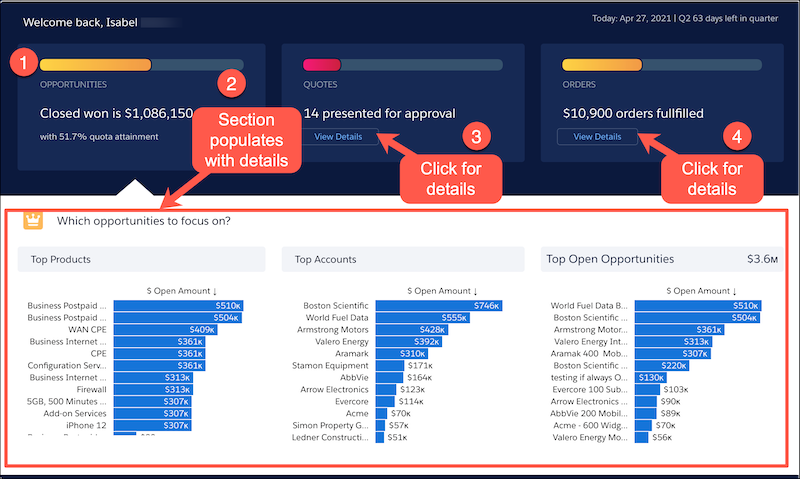
The dashboard is divided into two panes that allows you to select an area of interest and click for more details.
| Section | Description |
|---|---|
| ( 1.) Opportunities, Quotes, and Orders | The top pane gives high-level information about three primary aspects of your Communications sales processes: opportunities, quotes, and orders. At a glance, you can see the closed-won amount, the number of quotes presented for approval, and the number of orders fulfilled. Hovering over the bar gives you even more details. |
| ( 2.) Opportunities detailed view | The bottom pane shows a detailed view of your opportunities. If this pane isn’t open, click View Details. |
| ( 3.) Quotes detailed view | To view information about your quotes, click View Details. The bottom pane populates with details about your quotes. |
| ( 4.) Orders detailed view | To view information about your orders, click View Details. The bottom pane populates with details about your orders. |
Understand Your Opportunities
| Section | Description |
|---|---|
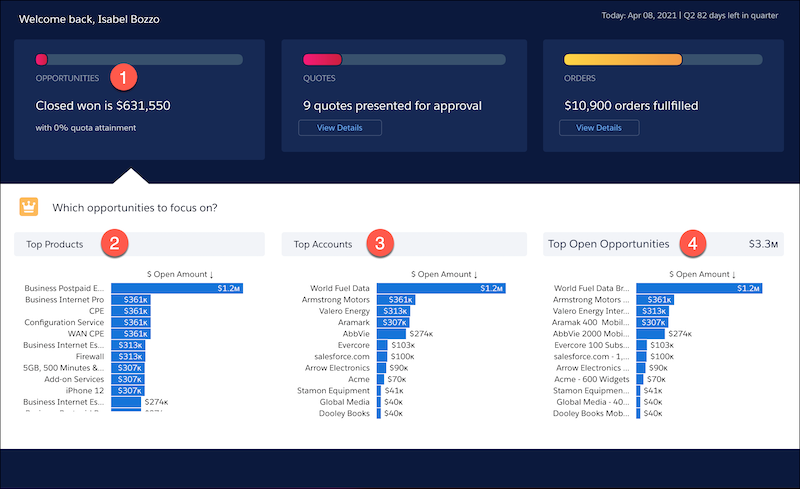
| ( 1.) Opportunities | Displays the closed won amount. You can also see the percentage of your quota attainment if you uploaded quota data. To understand your opportunities, click the View Details button. |
| ( 2.) Top Products | Displays the products you selected when creating the opportunity sorted by dollar amount. This metric can help you understand which products to focus on. |
| ( 3.) Top Accounts | Displays the accounts with the most opportunities stacked by dollar amount. This metric can help you determine which accounts to focus on. |
| ( 4.) Top Open Opportunities | Displays your current opportunities stacked by dollar amount. This metric helps surface the opportunities to help meet your quota. |
KPI Calculations
- % Quota attainment: Sum of Quota Amount / Amount as %.
- Opportunities Closed Won: Sum of amount.
- Top Products chart: Sum of amount by Product Name.
- Top Accounts chart: Sum of amount by Account Name.
- Top Open Opportunities chart: Sum of amount by Opportunity Name.
- Top Open Opportunities: Sum of Amount.
Understand Your Quotes
| Section | Description |
|---|---|
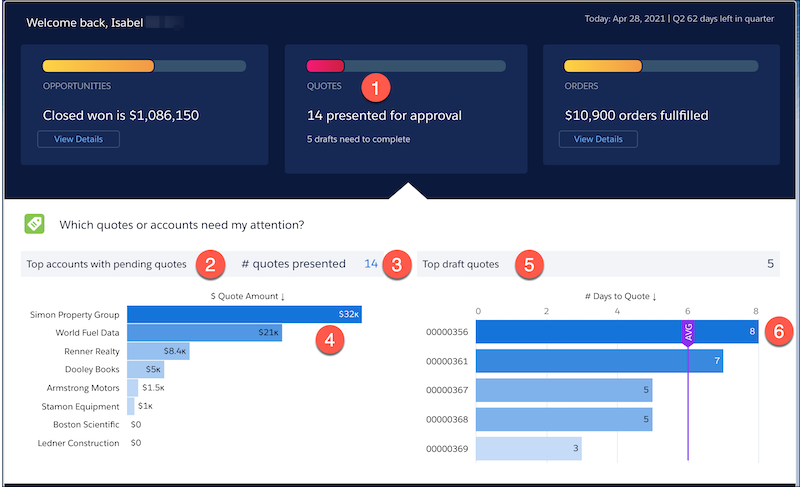
| ( 1.) Quotes | Details about your quotes with emphasis on the most important milestones or status. To understand your quotes, click the View Details button. |
| ( 2.) Top Accounts with Pending Quotes | The top accounts with quotes not yet been presented to the customer. |
| ( 3.) # quotes presented | The number of quotes presented to the customer. To see a detailed chart of the presented quotes, including the margin and the number of days since presented to the customer, hover over the number. |
| ( 4.) Quote Amount | The pending quotes presented but not yet accepted or denied by the customer. This metric helps you to see where you must follow up on a presented quote. |
| ( 5.) Top draft quotes | The quotes in draft that haven’t yet been presented to customers, stacked by dollar amount. A proposal hasn’t been generated or sent to a supervisor for approval. |
| ( 6.) Days to Quote | The time it took to configure your quotes compared to the average time it’s taken you in the past. The quotes that have the longest days to quote are the ones that need your attention. |
KPI Calculations
- %Quotes Accepted: Sum of Accepted Quotes / Total Quotes as %.
- Top Account with Pending Quotes Chart: Sum of vlocity_cmt__EffectiveQuoteTotal__c by Account Name.
- #Quotes Presented: Count of Rows.
- Tooltip Days presented: Now() - LastModifiedDate.
- Top draft quotes: Count of Rows.
- # Days to Quote Chart: Now() - CreatedDate.
Understand Your Orders
| Section | Description |
|---|---|
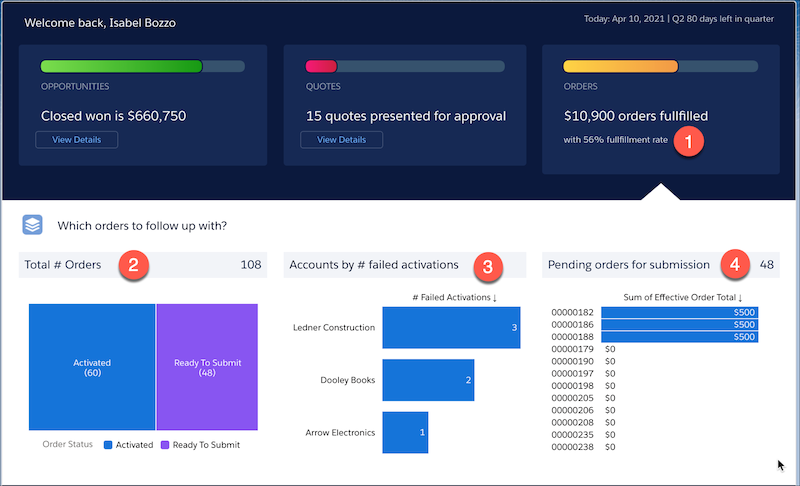
| ( 1.) Orders | Details about your ordering process. To understand your orders, click the View Details button. |
| ( 2.) Total # Orders | Orders and their fulfillment status. Use this metric to understand the status of all of your orders and how many orders need attention. |
| ( 3.) Accounts by # failed activations | Accounts that had issues with activation, sorted by most to least issues. You can check this section before presenting orders to customer so that you don’t attempt to sell to an account that is experiencing issues. |
| ( 4.) Pending orders for submission | Orders that haven’t yet been submitted, sorted by the highest to lowest dollar amount. The sum of the effective total order is the calculated total value of the entire order. |
KPI Calculations
- % Orders Fulfilled / Fulfillment Rate: Sum of Activated Orders / Total Orders as %.
- Orders Fulfilled: Sum of vlocity_cmt__EffectiveOrderTotal__c.
- Total # Orders: Count of Rows.
- Total Orders by status: Count of Rows by vlocity_cmt__OrderStatus__c.
- Accounts by # failed activations chart: Count of Rows by Parent Account Name.
- Pending orders for submission: Count of rows.
- Pending orders for submission chart: Sum of vlocity_cmt__EffectiveOrderTotal__c by Order Number.
Did this article solve your issue?
Let us know so we can improve!