
You are here:
Analytics Design Toolkit
Use the Analytics Design Toolkit to create an app with ready-made dashboard, charts, and widget templates that you can use to get started fast with your own apps.
Required Editions
| User Permissions Needed | |
|---|---|
| To create and manage the Analytics Design Toolkit app: | Manage CRM Analytics Templated Apps |
| To use the Analytics Design Toolkit app: | Use CRM Analytics Templated Apps |
The Analytics Design Toolkit gives you a starting point for your own CRM Analytics app design and development. The app’s dashboard, chart, and widget templates follow the internal Salesforce design guidelines. Brand the app with your own color, then apply the designs to your own data to build your own app.
Create the Analytics Design Toolkit
If you have newly enabled CRM Analytics, the app is created for you by default. If you have already enabled CRM Analytics for your org, you can install it manually using the instructions below, or you can enable auto-installation in the Settings menu.
The Analytics Design Toolkit configuration wizard requires that you select a color for your app. Click the disclosure triangle next to the color square on the left of the wizard page and select a color. You can also manually enter values for Hex, R, G, and B. Then click Done.
Use the Analytics Design Toolkit
Open the app.
- From the app picker
 , select CRM Analytics
Studio to open the CRM Analytics home page.
, select CRM Analytics
Studio to open the CRM Analytics home page. - Under Browse in the left column, select All Items.
- Select the Apps tab, then click your app to open it. If you can’t immediately find it, consult your Salesforce administrator to find out the name they gave it when creating the app.
Click Run App to open its dashboard, which includes three tabs:
- Styles. Shows you the styles used in the app, including colors, typography, and widgets.
- Components. Dashboard components are a type of dashboard widget that can contain other widgets, pages, and Lightning Web Components. Use dashboard components to manage and reuse groups of charts, tables, filters, text, and more in multiple dashboards.
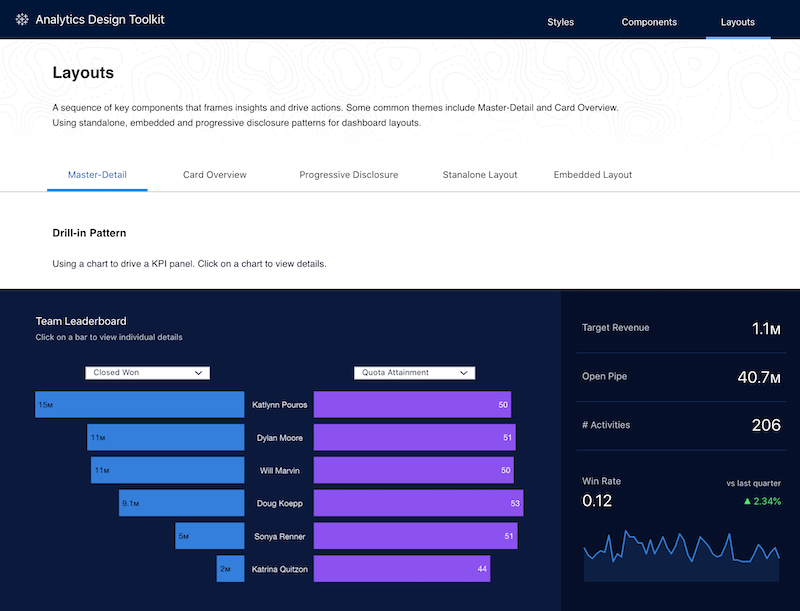
- Layouts. The layout helps define how the viewer interprets data. The layout helps to frame insights and drive actions.
Design Style Guide includes two datasets based on CSV files to populate the examples in the app. Add your own data to the app, then reuse the examples to build your own app. See Build CRM Analytics Dashboards.
Create Your Own Beautifully Designed Apps
Here are some tips for putting Design Style Guide to use in your own app designs:
- When you create the app, select the color pattern that most closely matches your brand or corporate identity.
- In the app’s dashboard, select the widget, component, or layout of your choice and move it to a new page in the app you’re building. From there, you can add metrics and other CRM Analytics Studio features using dashboard designer.
- Create a new layout by saving a new copy of the dashboard in your own app and moving widgets around. The template created them with the color pattern of your choice, so they’ll already reflect your brand.