
You are here:
Summarize Report Data
When you want to know sum, average, highest, or lowest value of a numeric column (like Amount, Age, or Probability), summarize the column. Summaries calculate subtotals for every group in a report, as well as a grand total for all report data.
Required Editions
| Available in: Salesforce Classic and Lightning Experience |
| Available in: Essentials, Group, Professional, Enterprise, Performance, Unlimited, and Developer Editions |
| Available in: Enhanced Folder Sharing |
| User Permissions Needed | |
|---|---|
| To create, edit, and delete reports: |
|
Summarize report data from the report builder (in Lightning Experience).
- Edit a report.
-
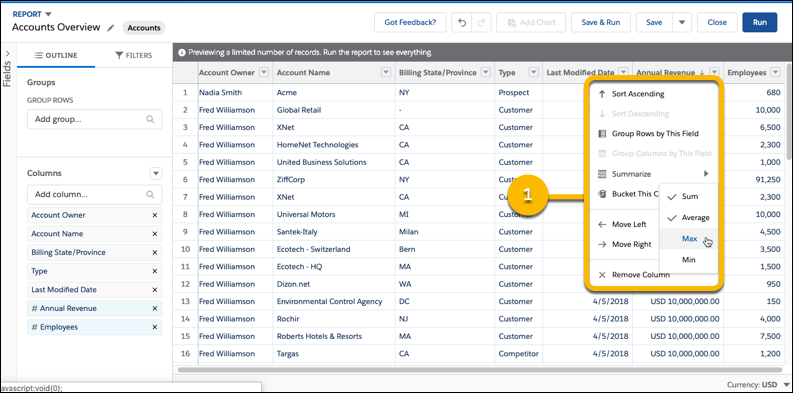
Find the numeric column you'd like to summarize. Click
 | Summarize, and then choose how you'd like to evaluate the data:
Sum, Average, Max,
Min (1).
| Summarize, and then choose how you'd like to evaluate the data:
Sum, Average, Max,
Min (1).
A check mark appears next to already-applied summaries. Click You can apply all four summaries at once.
-
If you don't see the Summarize option, it means that the column
isn’t numeric. To add a numeric column, expand the Fields pane and
either double-click a numeric field or drag it into the Columns list.
Each field's type is denoted by an icon directly to the left of the field name. Numeric fields are identified by a number sign (
 ).
). -
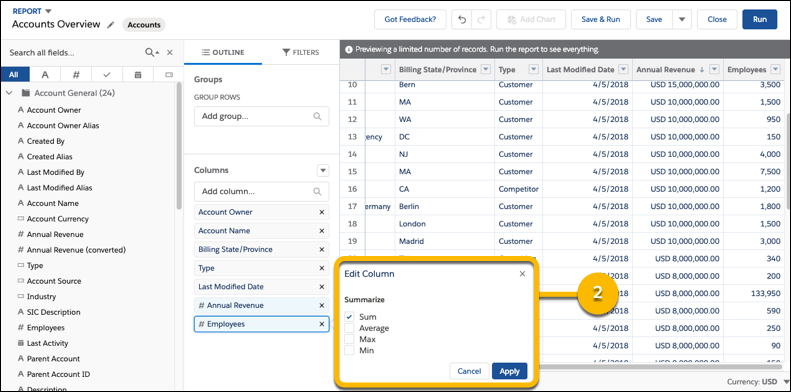
Optionally, there’s a second way to summarize a numeric field (2).
- From the Columns section of the OUTLINE panel, click the numeric field you want to summarize.
- Then, select the summary function you wish to calculate: Sum, Average, Max, Min.
-
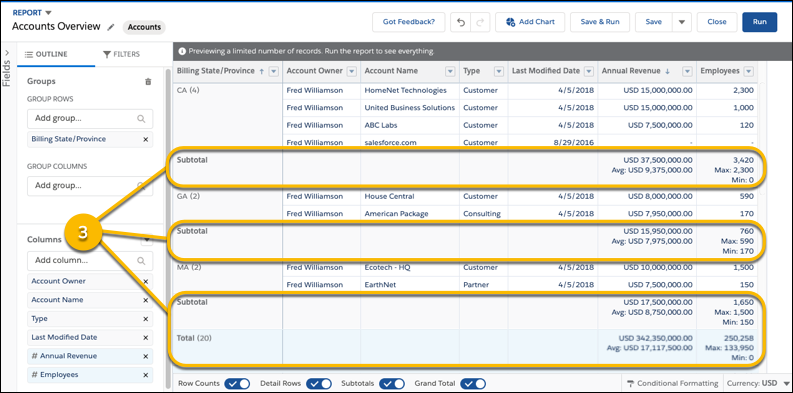
Click Apply
For each group in the report, every summary you apply appears as a subtotal. At the bottom of the report, summaries appear as a total (3). The report builder preview displays data for a limited number of records. Save and run the report to see everything.
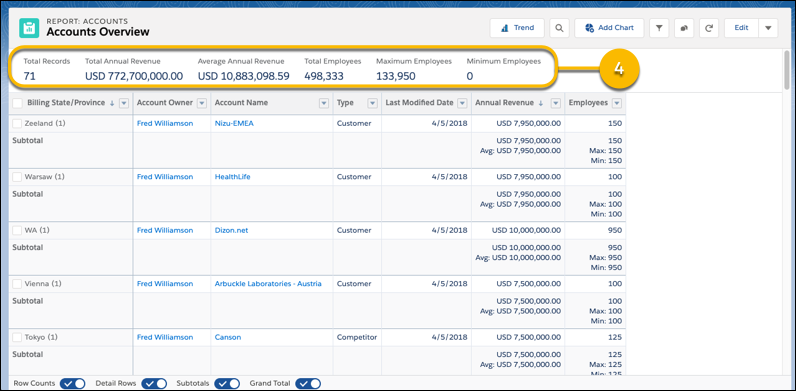
When viewing the report on the run page, summaries also appear at the top of the report (4).
No need to
add amounts together. No need to write a formula. Instead, summarize the
Amount column. Click ![]() | Summarize, and then choose how you'd like to evaluate the data:
Sum, Average, Max,
Min. For this example, choose Sum and
Average.
| Summarize, and then choose how you'd like to evaluate the data:
Sum, Average, Max,
Min. For this example, choose Sum and
Average.
Add a Summary Field
To add a summary field:
- Double-click a number field in the Fields pane.
- Drag a number field into the preview. Press CTRL to select multiple fields. For matrix reports, there are drop zones before, between, and after sets of summaries. For example, the sum, average, max, and min of Annual Revenue are a set, and you can't drop a new summary field between them.
- Choose Summarize this Field in the column menu for a field already in the report.
To change an existing summary field, or add other summaries on that same field, click
![]() next to the summary field and choose Summarize this
Field.
next to the summary field and choose Summarize this
Field.
Reorder sets of summary fields in matrix reports by dragging them. The summaries for each field move together when dragged. For example, if your report contains the sum and average of Annual Revenue, and the max and min of Probability, you can drag the Probability summaries before or after the Annual Revenue summaries, but not between. Summaries can't be placed after custom summary formulas or Record Count.
Summarize Report Data in Salesforce Classic
The Fields pane displays fields from the selected report type, organized by folder.
A summary is the Sum, Average,
Max, or Min for a number field. (Use the
filter
to find them faster.)
To remove a summary field:
- Click its menu and choose Summarize this Field and deselect all options.
- Click its menu and choose Remove Summary.
- Drag the summary set back to the Fields pane. All summaries for that field are removed. Press CTRL to select multiple summary fields.