You are here:
Joined Report Examples
Creating a sales rep performance scorecard, reviewing support cases by status, and predicting your opportunity pipeline are some examples of what you can do with joined reports. Here’s how.
Required Editions
| Available in: both Lightning Experience and Salesforce Classic |
| Available in: Enterprise, Performance, Unlimited, and Developer Editions |
| Available in: Enhanced Folder Sharing |
| User Permissions Needed | |
|---|---|
| To create, edit, and delete joined reports: |
|
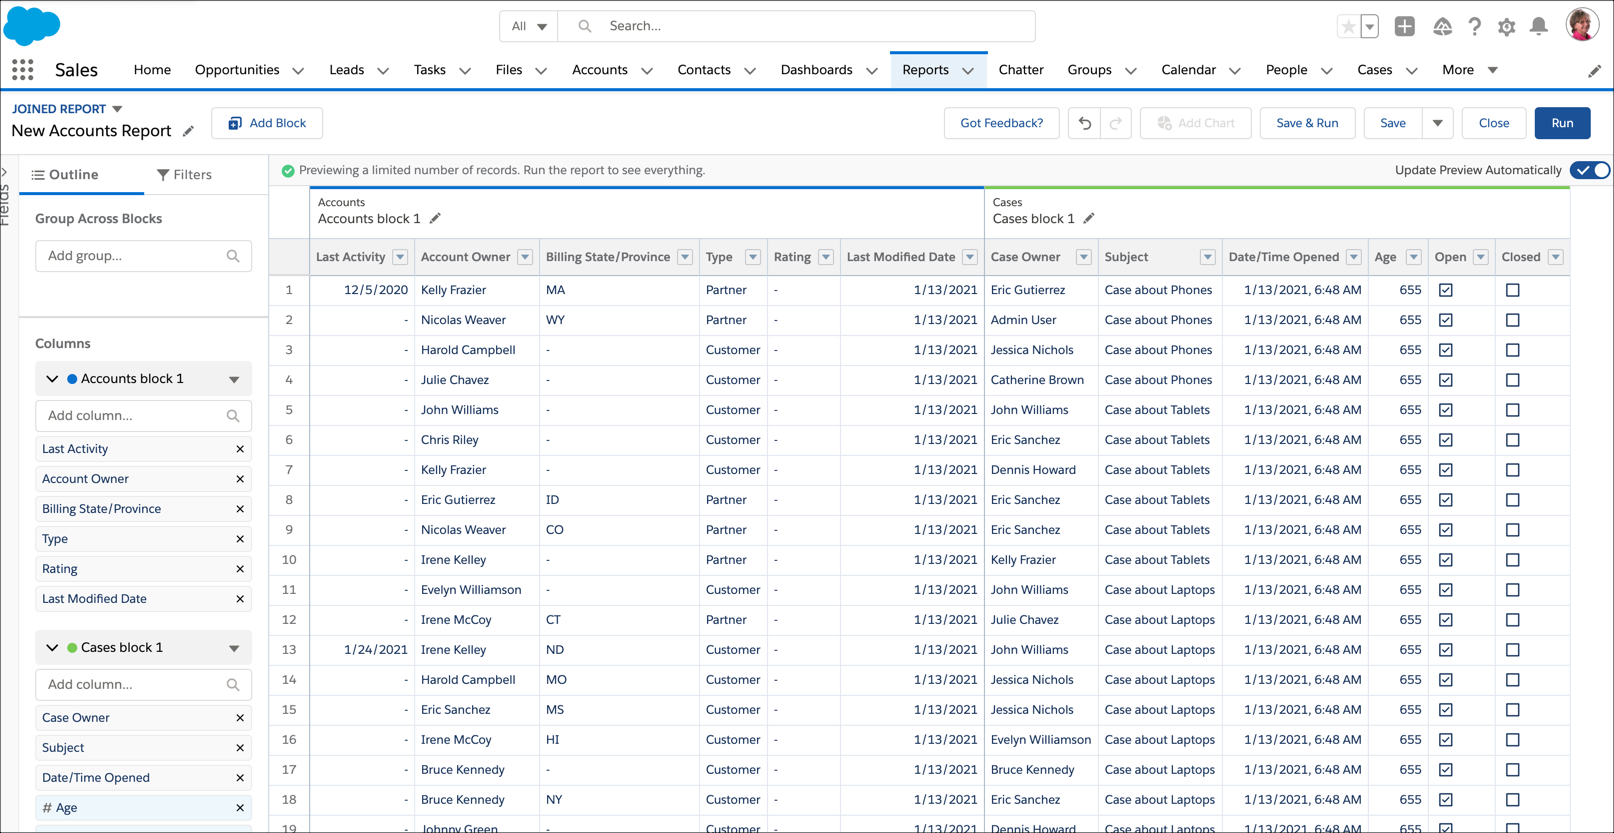
Accounts with Open Cases (Lightning Experience)
A joined report is an ideal way to see Accounts that have open Cases.
- On the Analytics tab, select Create | Report, or on the Reports tab, click New Report.
- Select the Accounts report type. Then, click Create.
- If necessary, customize standard filters. For example, set Show to All accounts and Range to All Time.
- The report opens in the report builder. To turn it into a joined report, in the upper left corner of the report builder, click Report | Joined Report | Apply.
- To add another report type to the joined report, click
Add Block.
- Choose the Cases report.
- Click Add Block.
- If necessary, continue to customize the report. For example, we
want to see only open cases, which we can achieve by adding
a field filter to block 2.
- From FILTERS, under the Cases block, click Add filter....
- Select Closed.
- Select False and click Apply.
- If necessary, group across blocks using common fields. Common fields are shared between all objects in the joined report. For example, we can group this report by Account Owner.
- Click Save and Run Report.
Admire your handiwork and start gaining actionable insights!
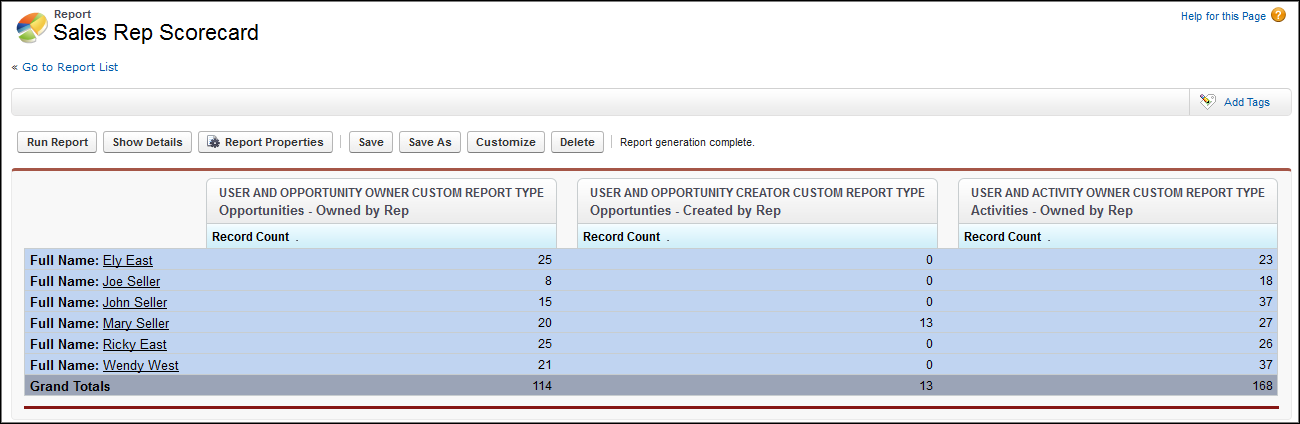
Creating a Sales Rep Performance Scorecard (Salesforce Classic)
A sales rep scorecard lets your sales management team understand the performance and actions of your organization’s sales reps. To create it, you must have three separate custom report types, each of which creates a relationship between User (as the primary object) and one of the following three objects: Opportunity Owner, Opportunity Creator, and Activity Owner. In this example, we’ve named the custom report types User and Opportunity Owner Custom Report, User and Opportunity Creator Custom Report, and User and Activity Owner Custom Report.
Start by creating a custom report based on the User and Opportunity Owner custom report type. Then add the User and Opportunity Creator and User and Activity owner custom report types as two additional blocks. Then, group by Sales Rep (opportunity owner) and set the filters as described in the procedure.
To create the report:
- Create a report, selecting User and Opportunity Owner Custom Report as the report type.
- Select Joined from the Format dropdown.
- Click Add Report Type.
- Select User and Opportunity Creator Custom Report.
- Click Add Report Type again, and choose User and Activity Owner Custom Report.
- Group the blocks by Full Name.
- Add additional fields and filters to the report as needed. For example, consider changing the date filters to focus on rep performance during a particular time frame. Or, to make sure that only sales people are included as opportunity owners, create a filter on the Role: Name filter limit your results to users with “Sales” in their roles.
- Optionally, provide names for the blocks.
- Click Save or Run Report.
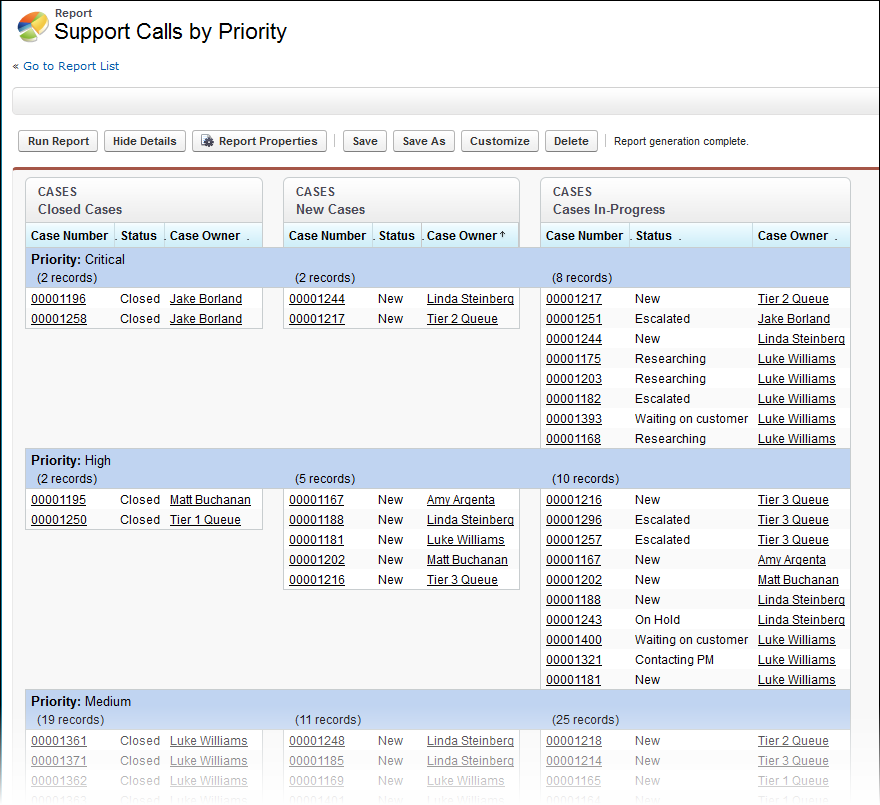
Reviewing Support Cases by Status (Salesforce Classic)
You can also create a report comparing the number of support cases that are new, closed, or in-progress by priority. The report contains a single standard report type: Cases. First, create the report, add three blocks to the report, filter each block by the appropriate status, and then use the Priority field for grouping.
To create the report:
- Create a report, selecting Cases as the report type.
- Select Joined from the Format dropdown.
- Remove unwanted fields by dragging them to the Fields pane.
- Create three blocks, each containing the Case Number and Status and, optionally, Case Owner fields.
- For each block, filter on all cases. Then, filter each
of the blocks by Status as follows:
- Block 1: Status equals Closed
- Block 2: Status equals New
- Block 3: Status not equal to Closed, New, Closed in Portal, Closed — First Call
- Group the blocks by Priority.
- Optionally, rename the blocks.
- Click Save or Run Report.
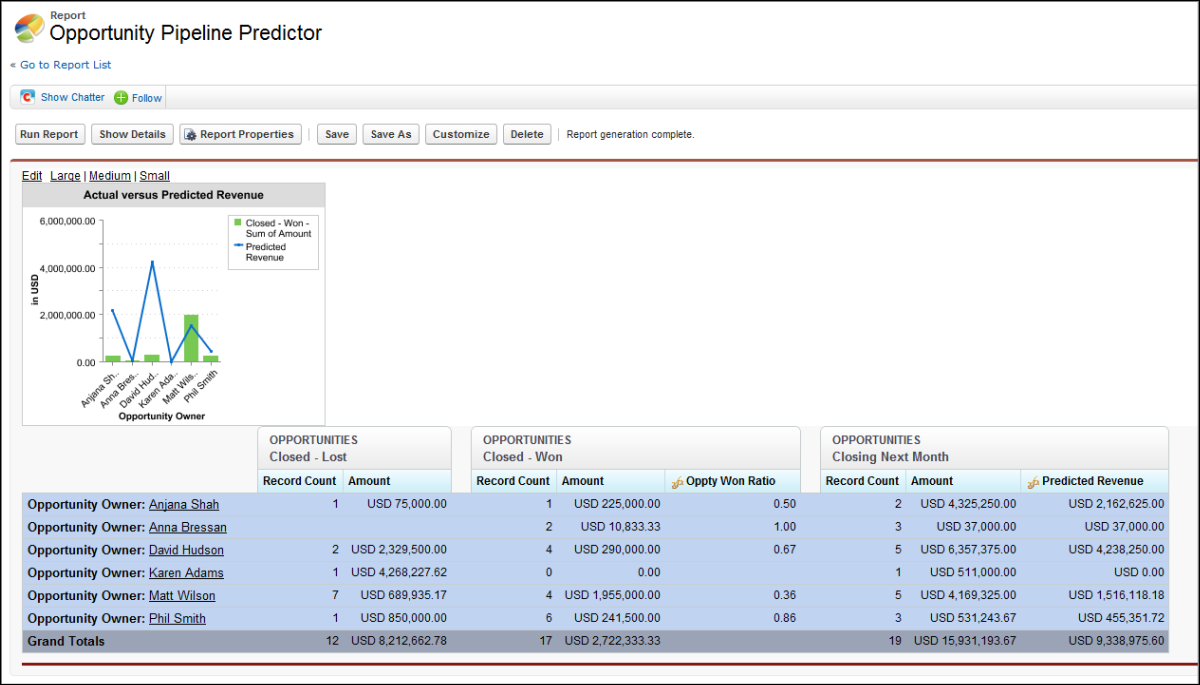
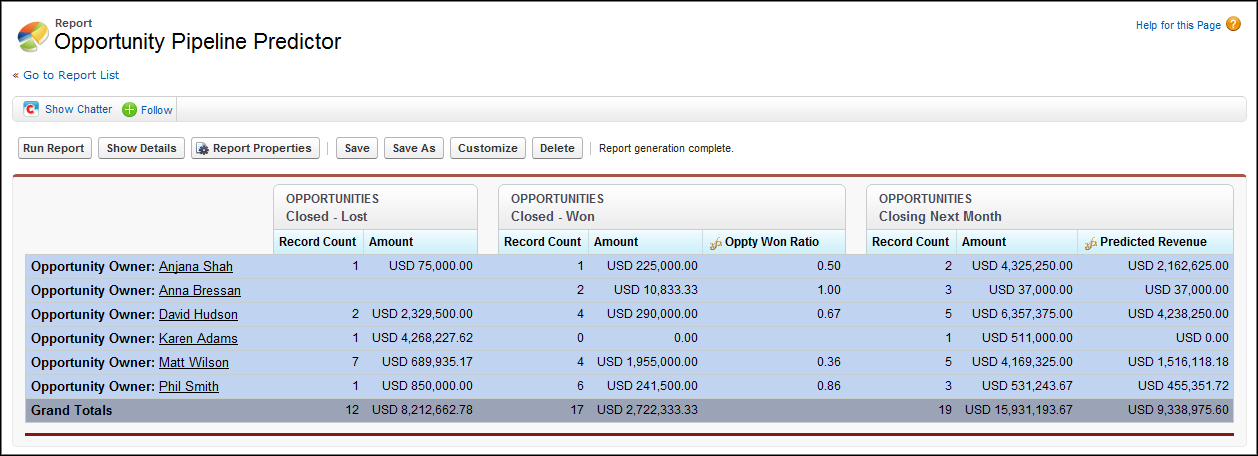
Predicting Opportunity Pipeline (Salesforce Classic)
Using cross-block custom summary formulas, you can create a report that predicts future opportunity revenue based on your sales reps’ past performance. Create a report based on the Opportunities standard report type. Add three blocks to the report, filter each block by the appropriate status, and then create a formula that uses fields from different blocks.
To create the report:
- Create a new joined report, selecting Opportunities as the report type.
- Remove unwanted fields by dragging them to the Fields pane.
- Create three blocks, each containing the Opportunity Name, Account Name and Amount fields.
- For each block, show All
Opportunities. Then, filter each block.
Block Filters Block 1 Opportunity Status equals Closed
Date Field equals Close Date
Range equals Current and Previous FY
Stage equals Closed Lost
Block 2 Opportunity Status equals Closed Won
Date Field equals Close Date
Range equals Current and Previous FY
Block 3 Date Field equals Close Date
Range equals Next Month
Opportunity Status equals Open
- Group the blocks by Opportunity Owner.
- Rename the blocks. For example, “Closed — Won”, “Close — Lost”, and “Closing Next Month”.
- Create a cross-block custom summary formula that
predicts upcoming revenue based on past sales rep
performance:
[Closing Next Month]AMOUNT:SUM*([Closed - Won]RowCount/([Closed - Lost]RowCount+[Closed - Won]RowCount)) - Add the formula to one or more of the blocks.
- Optionally, add a cross-block custom summary formula
that calculates the win ratio of each sales
rep:
[Closed - Won]RowCount/([Closed - Lost]RowCount+[Closed - Won]RowCount) - Click Save or Run Report.
Adding a Chart to the Opportunity Pipeline Predictor Report (Salesforce Classic)
You can include a chart with a joined report to provide a visual representation of the data. For example, you can add a chart to the Opportunity Pipeline Predictor report that shows actual versus predicted revenue.
To add the chart:
- Create the Predicting Opportunity Pipeline report as described in the previous section. .
- Click Add Chart.
- For the Y-axis, select Closed — Won — Sum of Amount.
- Select Plot additional values.
- Select Line for the Display option, and Predicted Revenue as the Value.
- Click the Formatting tab, and enter Actual versus Predicted Revenue as the chart title.
- Click OK.
- Click Save or Run Report.