You are here:
Analyze Report Data
Let Einstein Discovery for Reports augment your report with AI and comprehensive statistical analysis to produce Einstein Discovery-powered insights into your data. Einstein does the analytic heavy lifting for you. Your efforts aren’t required to group report data, or summarize it, or chart it (unless you really want to).
Required Editions
| Available in Lightning Experience |
| Available in Enterprise, Performance, and Unlimited Editions. Also available in Developer Edition. |
| User Permissions Needed | |
|---|---|
| To start an analysis: | Can Run Einstein Discovery for Reports |
-
For an introduction, check out the Einstein Data Insights: Quick Look Trailhead module.
- Consider Report Tips for Einstein Discovery for Reports.
To get insights into your report data:
-
Run a Tabular and Summary report that has at least 2 columns and 50 rows of
data.
For help with building a report, see Build a Report in Salesforce Help.
-
In the Toolbar, click Analyze.

 Note If the Analyze button is visible but disabled, then be sure to enable Detail Rows at the bottom of the run page. The Insights button is enabled only when Detail Rows is enabled.
If there are no existing analyses on a report, Einstein Discovery for Reports automatically runs an initial analysis. Einstein counts the number of values (frequency count) in the report and looks for statistically significant occurrences of values in the report data.
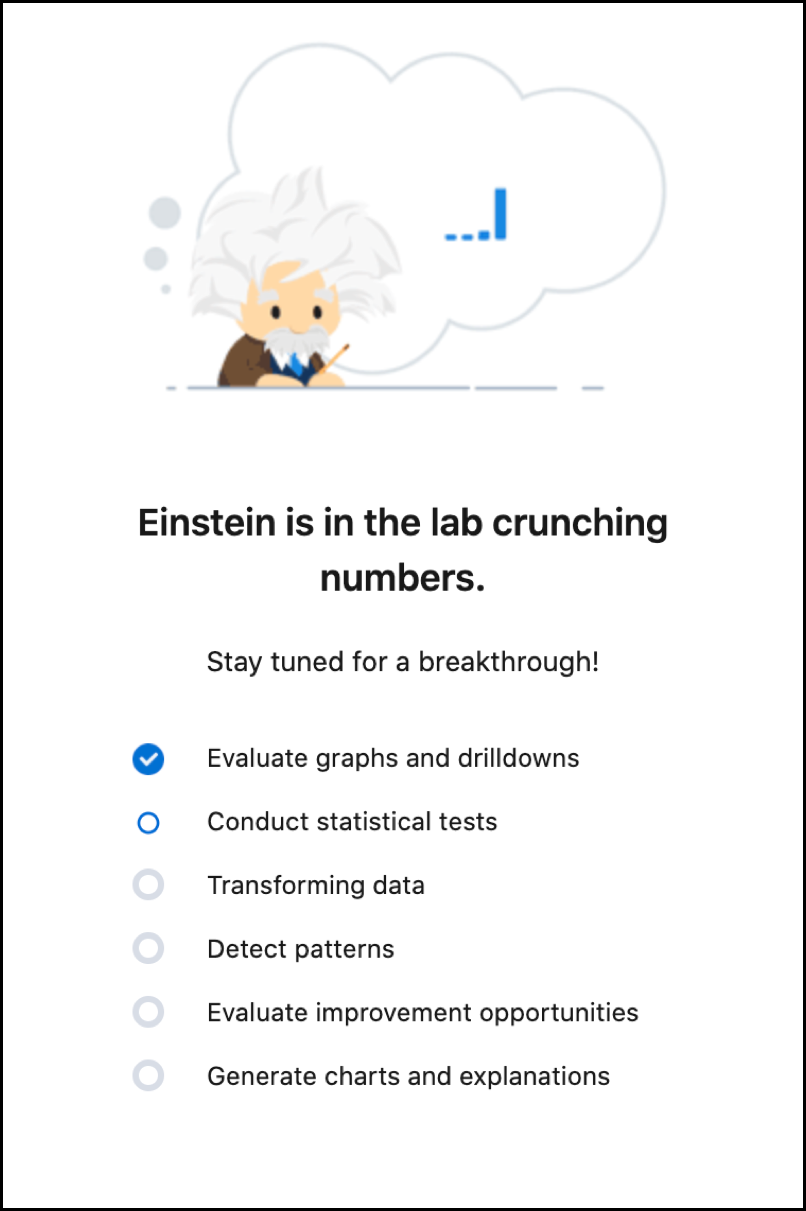
Einstein displays the results of its Occurrences analysis.
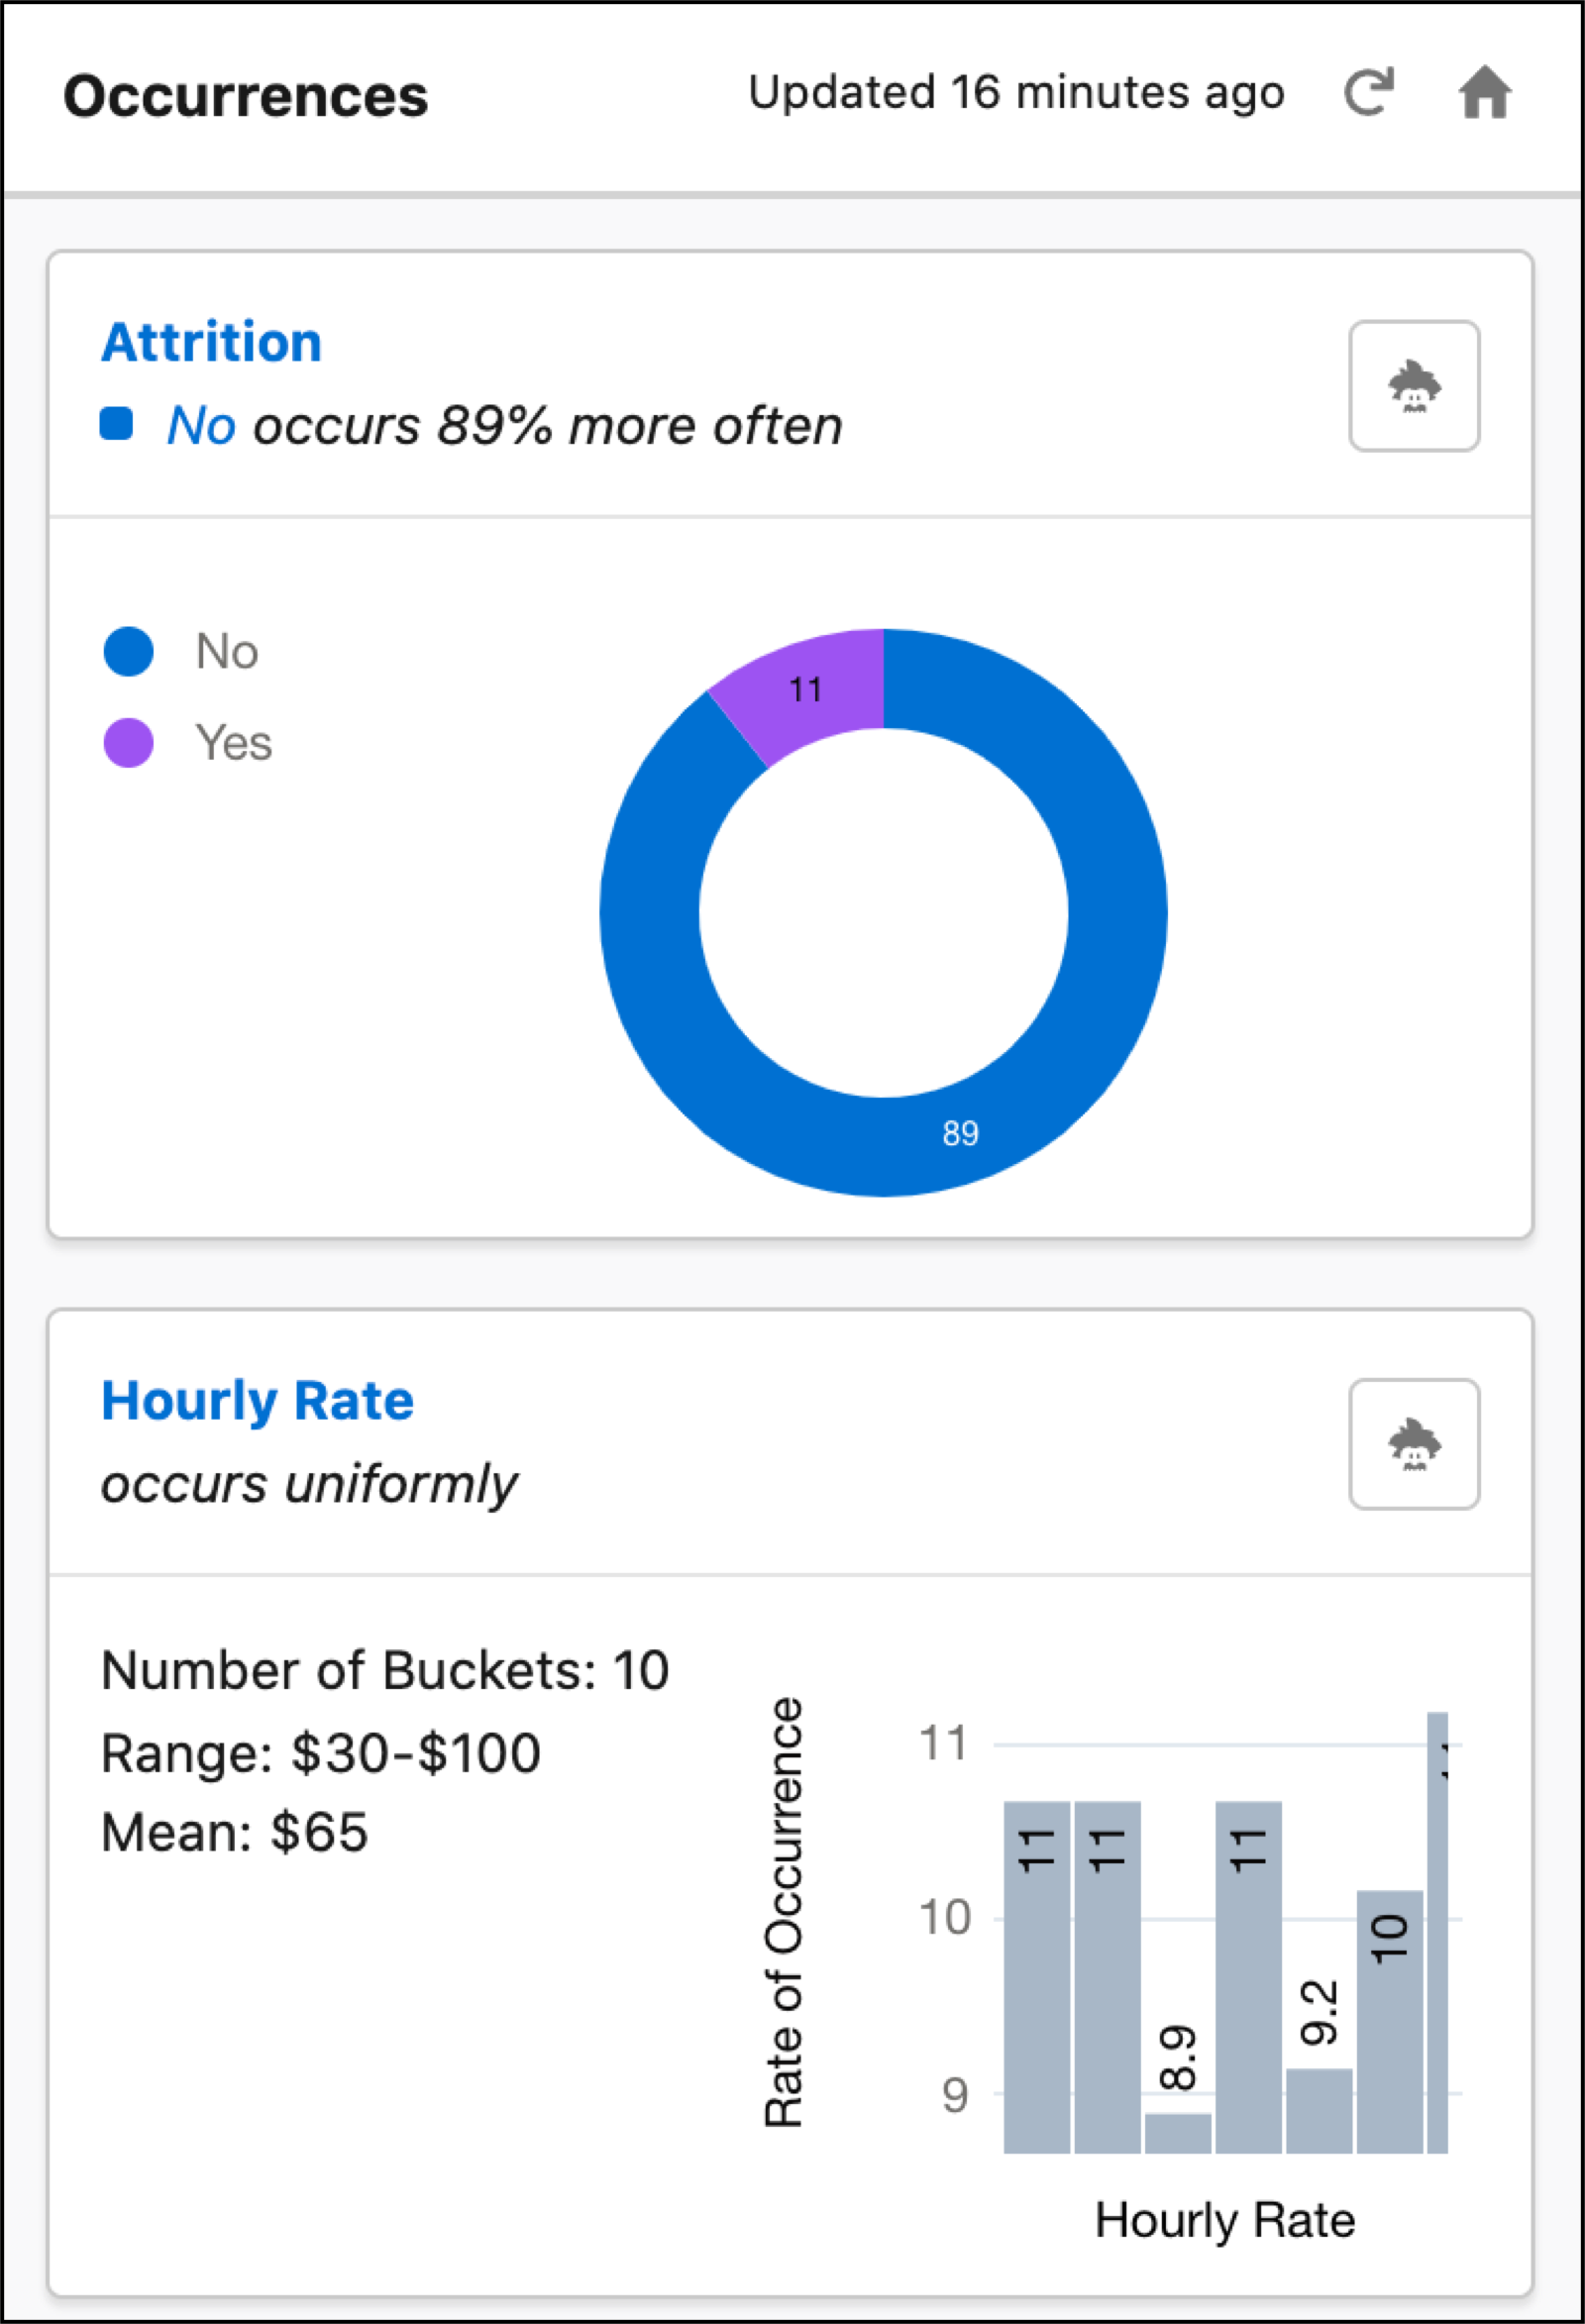
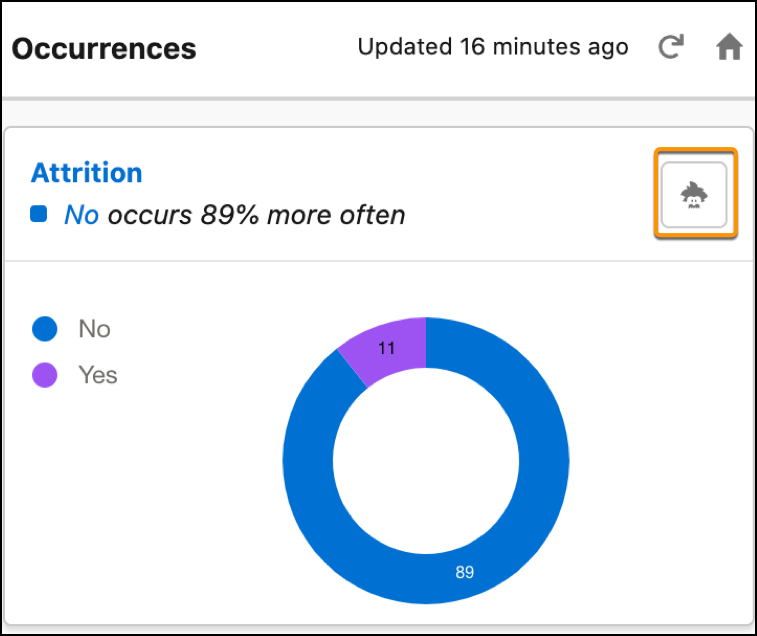
You can initiate a new insight by clicking the Einstein icon and move on to Step 3.
Otherwise, you can filter to a specific insight by clicking it.
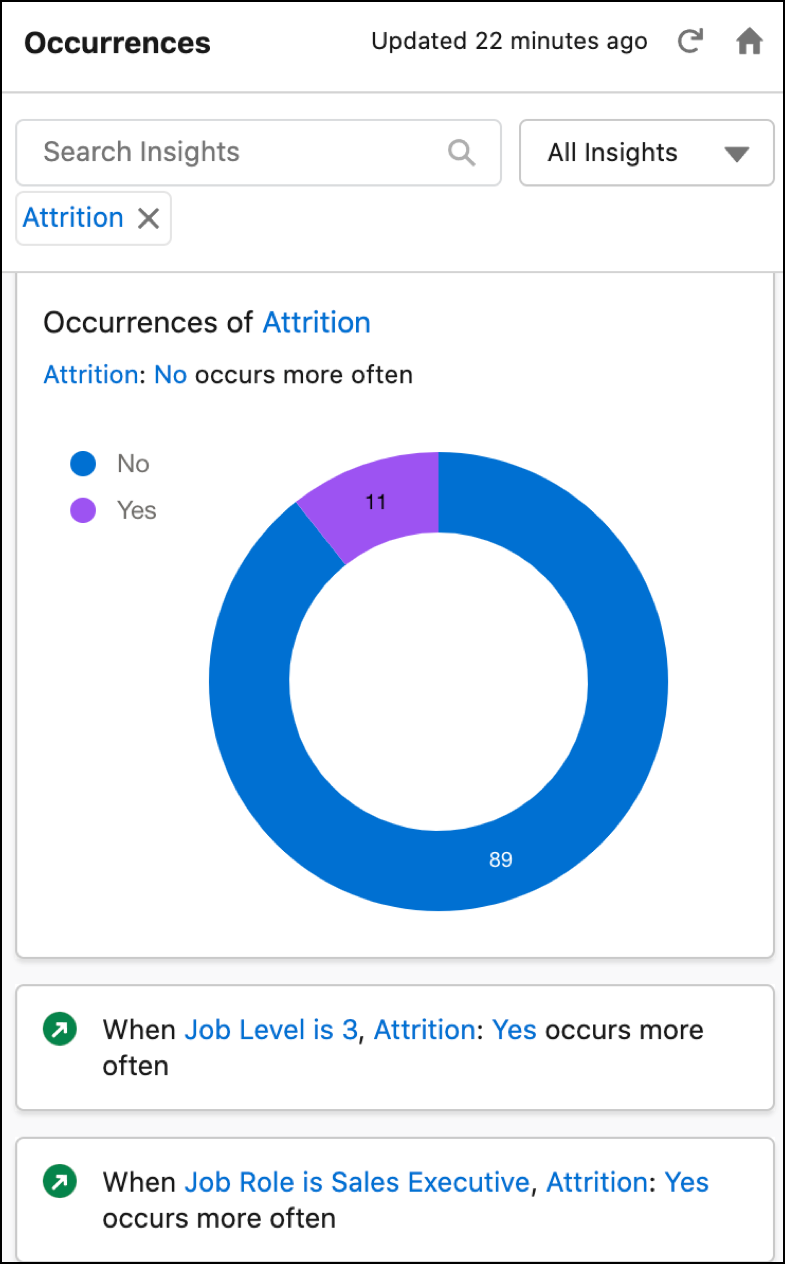
When you finish scrolling through the Occurrences insights, click Home on the toolbar to create other analyses.

The Einstein Discovery for Reports panel appears.
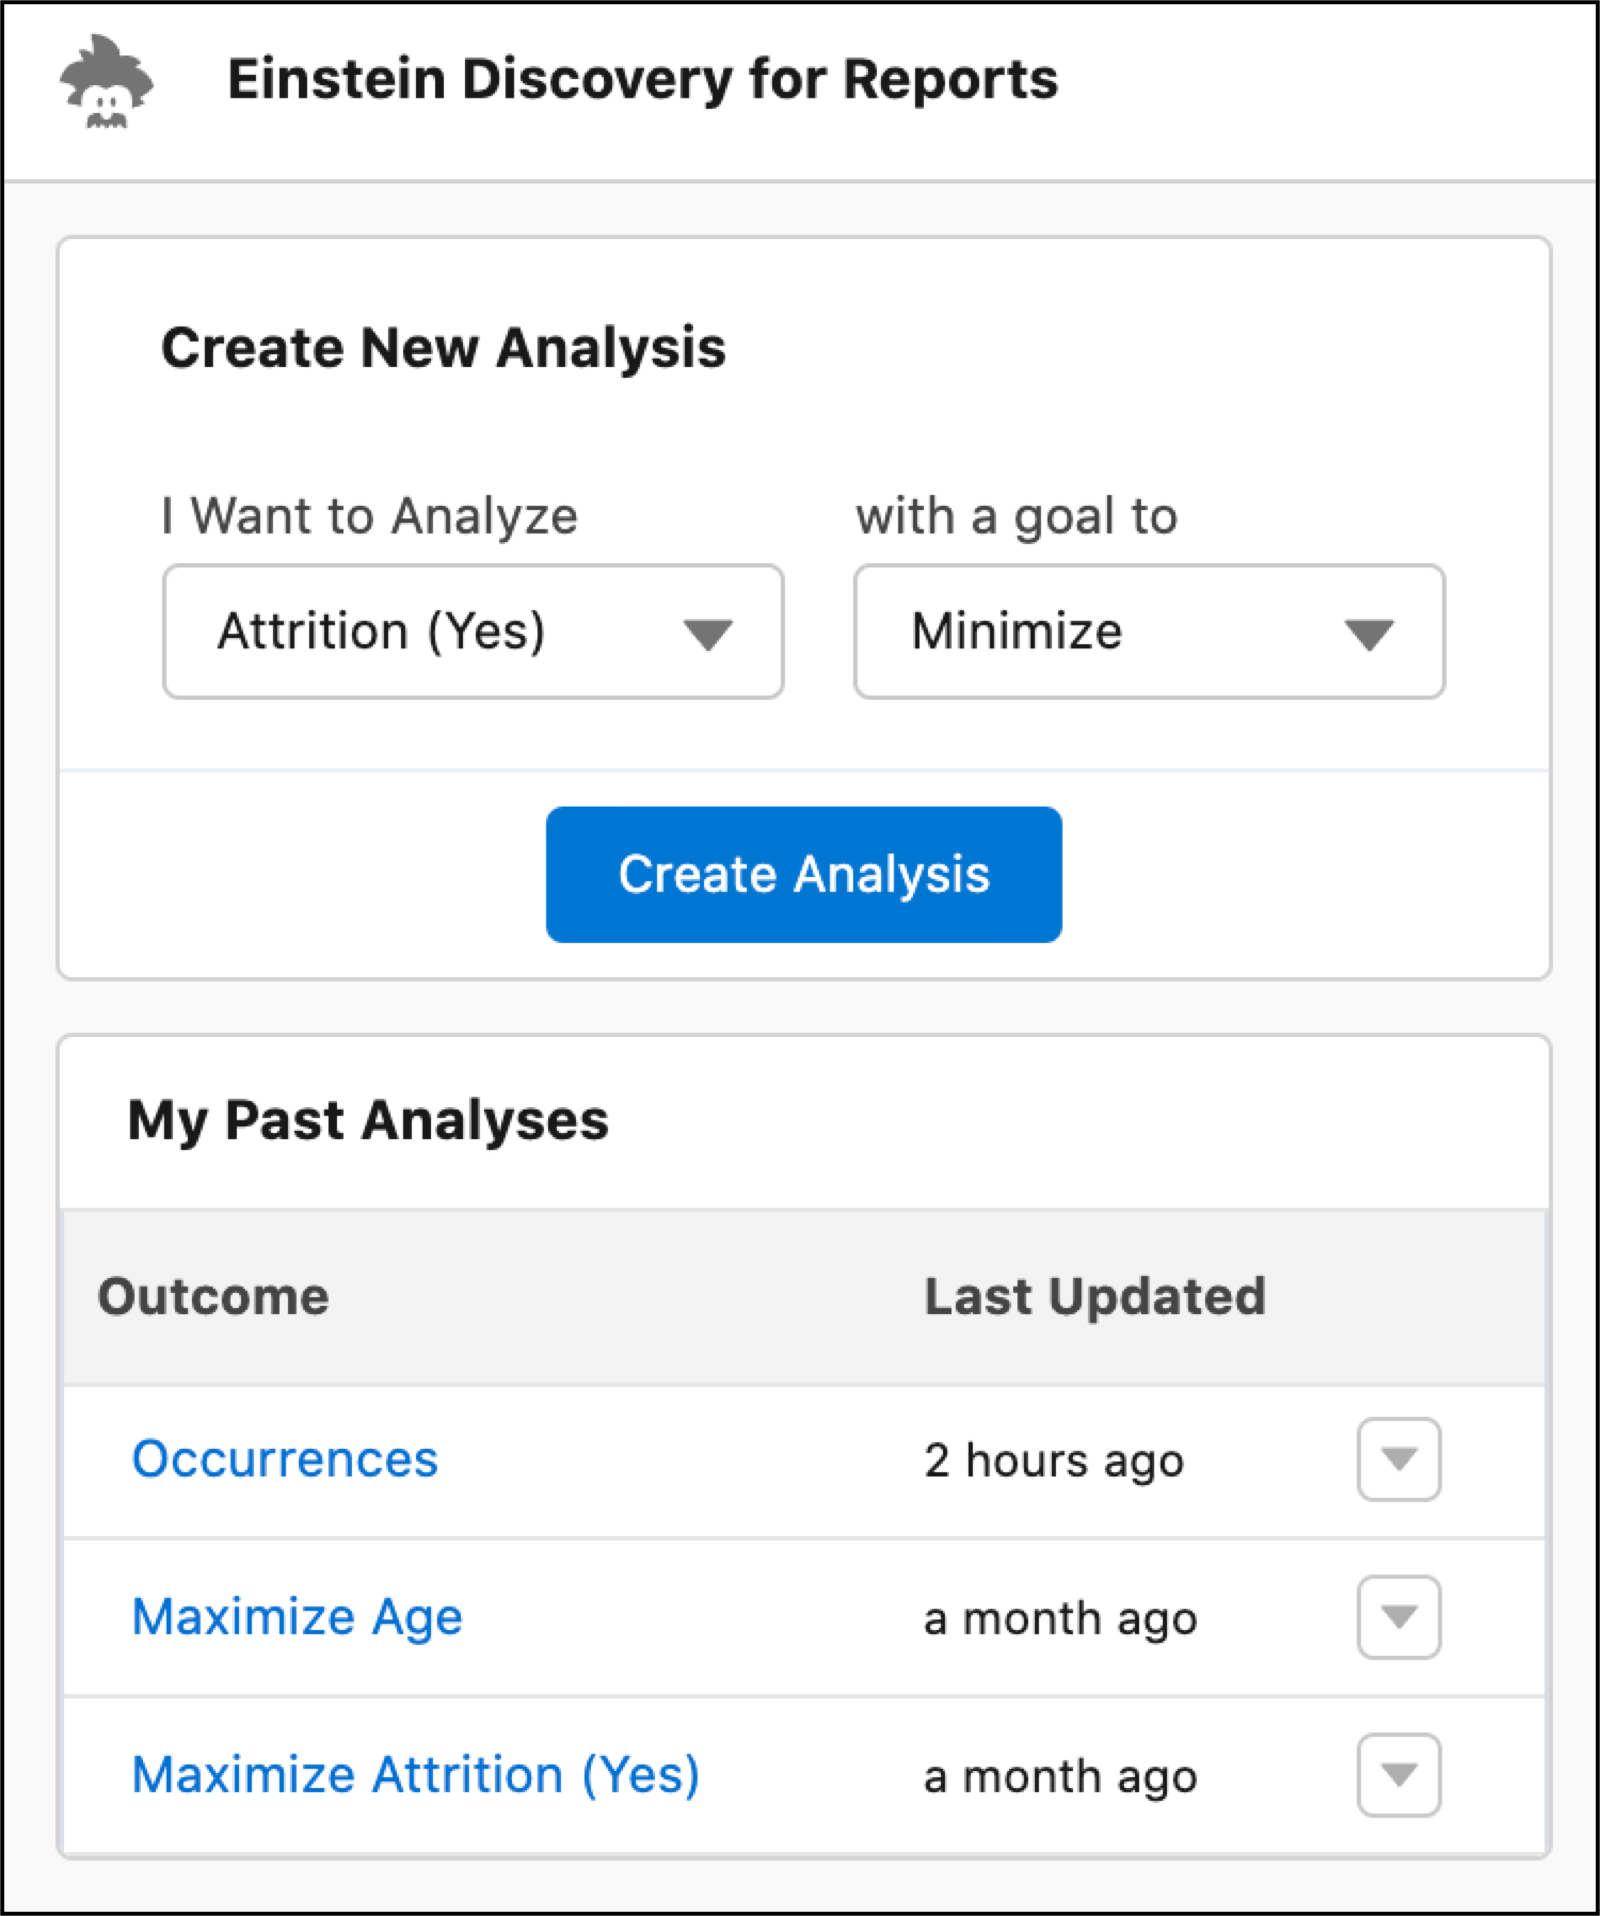
If you see a My Past Analyses for this report, you can click one to run a past analysis, and then skip the next two steps.
- If you want, change the focus of Einstein’s analysis. From I Want to Analyze, select a different outcome from the list of candidate report columns, or select Occurrences if you want to analyze the number of times (frequency count) a value has occurred. From with a goal to dropdown, select whether you want Einstein’s analysis to Maximize or Minimize the outcome. If you can’t find the variable you want, edit the report and add the desired column. Outcomes can be numeric fields (measures) or text fields with two values (such as w/lost, churn/not-churn, or public/private).
-
Click Create Analysis.
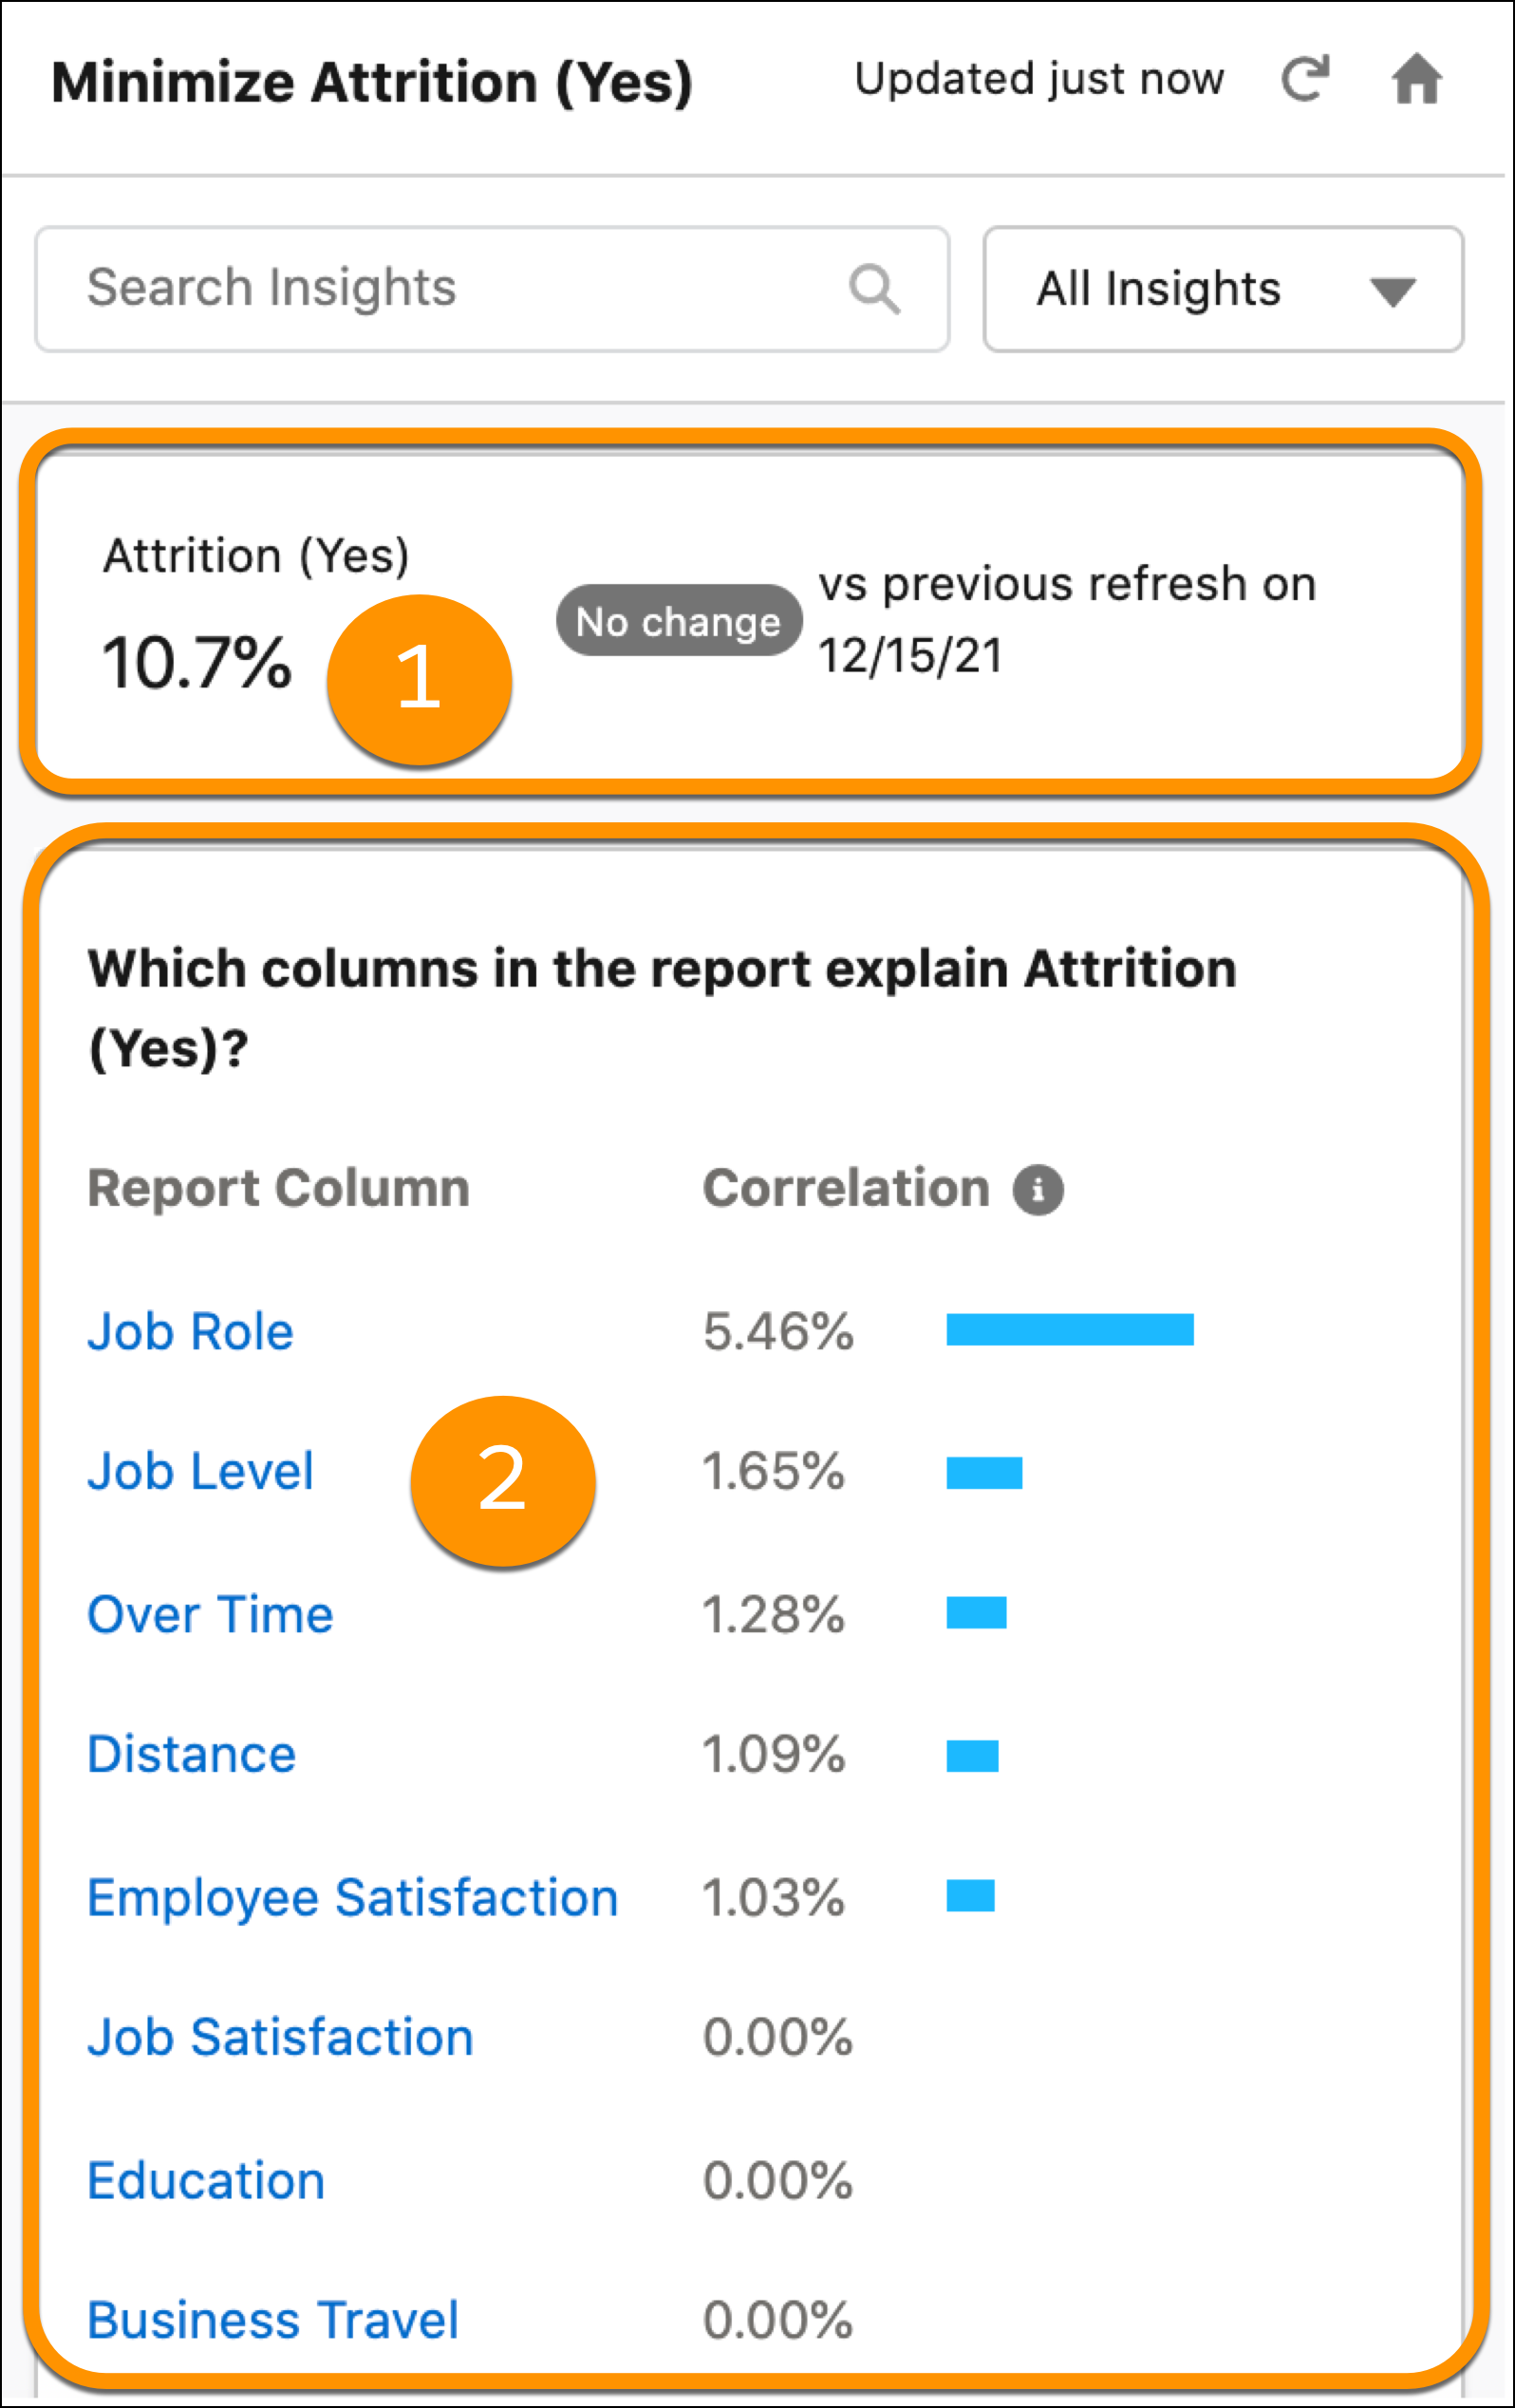
Einstein begins analyzing your report data. When finished, Einstein shows you a summary of the findings (1) and the report columns (2), ranked by correlation to the goal you selected.
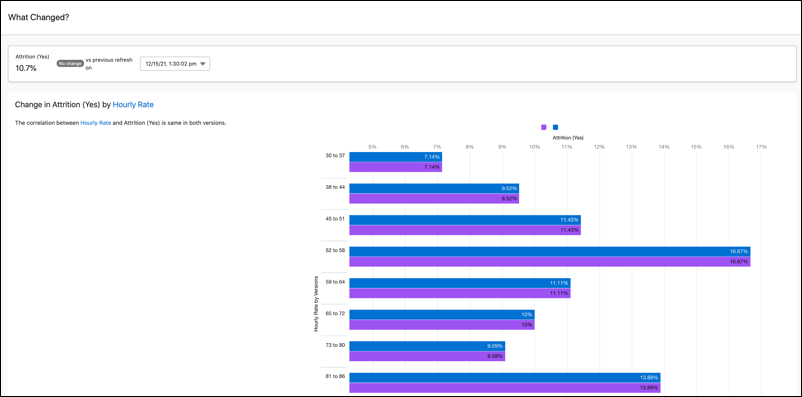
- If this analysis was run previously, Einstein displays a change summary
that shows you the net difference between versions. To compare versions
side-by-side, click the summary.
- The higher the correlation, expressed as a percentage, the stronger the
statistical relationship, and the more likely it's worth a closer look.
Note Keep in mind that correlation is not causation. Correlation merely describes the strength of association between variables, not whether they causally affect each other.
- If this analysis was run previously, Einstein displays a change summary
that shows you the net difference between versions. To compare versions
side-by-side, click the summary.
-
Scroll down to review the list of insights that Einstein uncovered in its
analysis.
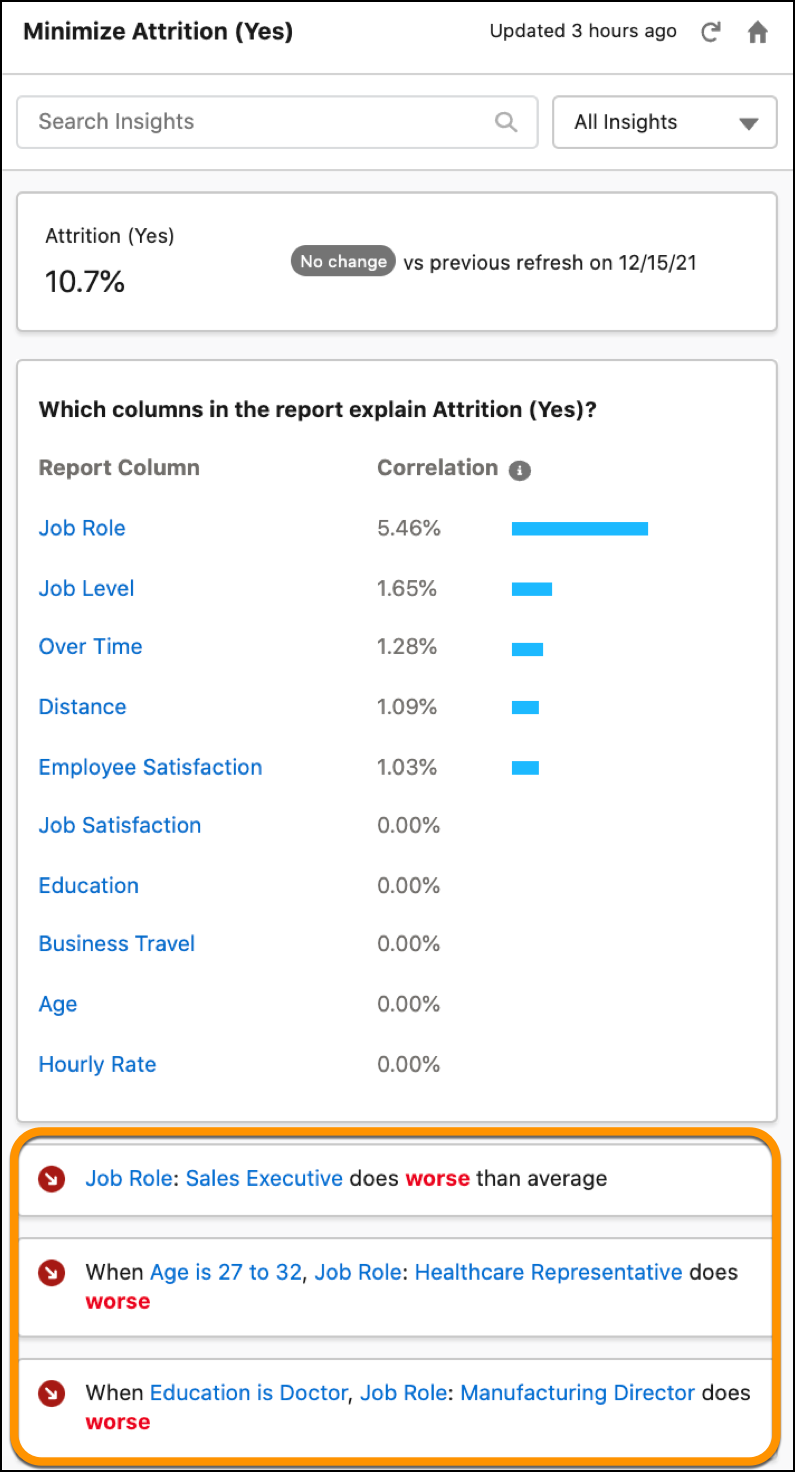
Einstein lists insights in order of statistical significance, starting with the insights that have the highest impact on the goal.
-
Click an insight that you're interested in learning more about.
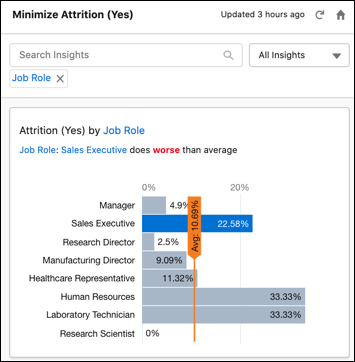
Each insight contains a name, a chart, a summary headline, and descriptive text (insight title and supporting details).
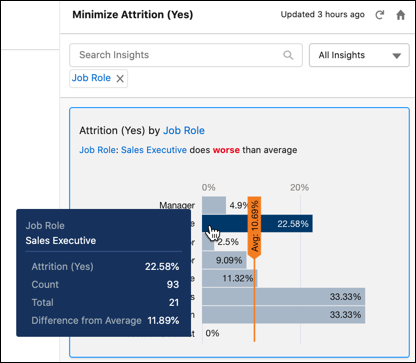
To display details about a particular segment in the chart, hover over it.
-
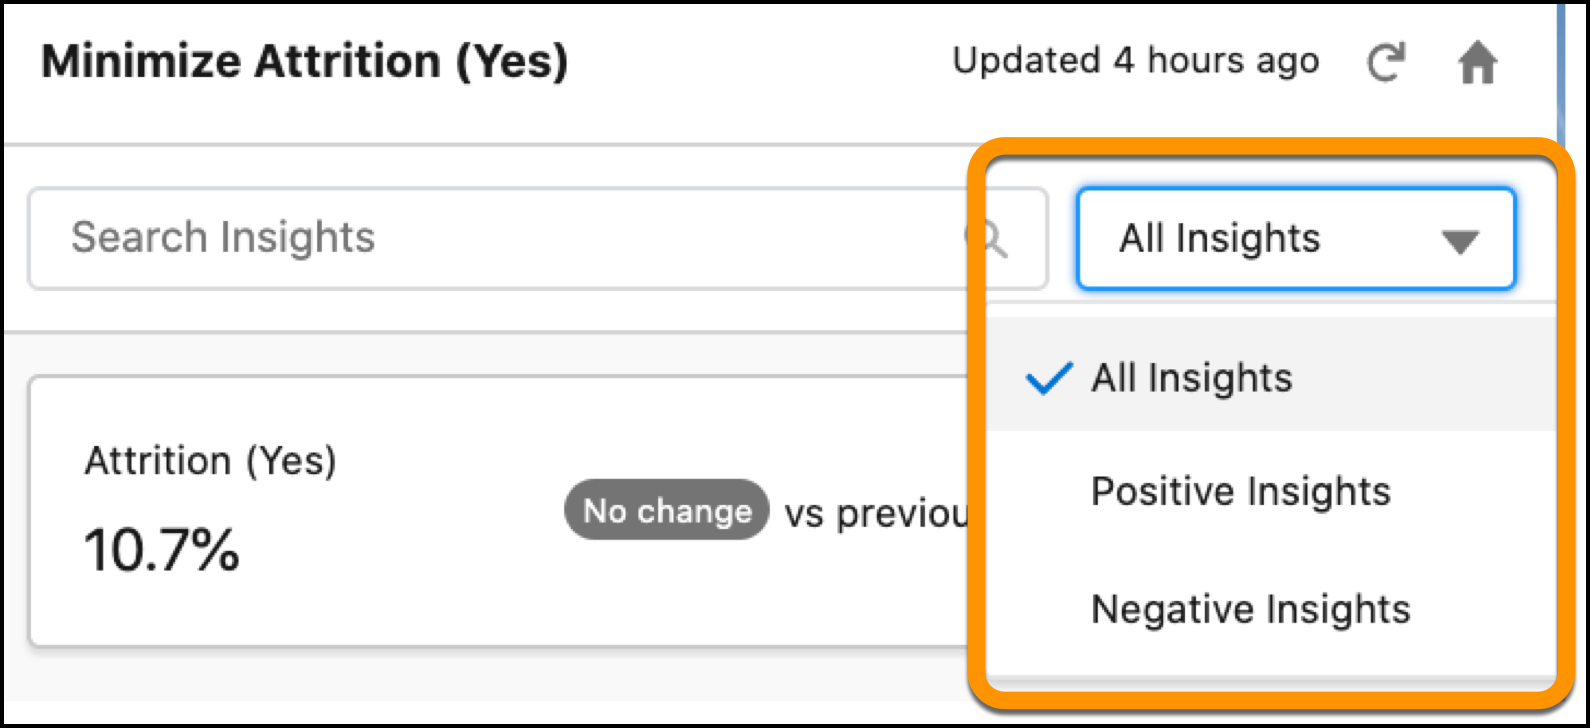
You can filter the insights list in several ways:
- To filter by keyword, enter text in the search box.
- To filter the insights list by impact (positive or negative) on the goal
you selected for analysis, click
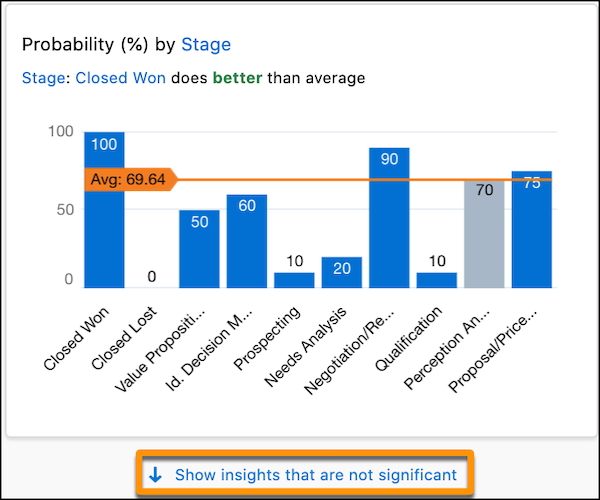
- By default, the only insights you see are the most statistically
significant insights. To see all insights, scroll to the bottom of the
insights list, and click Show insights that are not
significant.
-
To refresh your analysis and create an analysis version, click the refresh
button.
Einstein begins analyzing your report data. When finished, Einstein updates the list of insights resulting from its analysis.