The Executive Overview dashboard template provides a high-level snapshot of critical
business KPIs, including revenue, profit margins, growth rates, risk management, and trend
analysis. It is designed for executives and senior leaders, highlighting monthly or quarterly
trends, enabling data-driven strategic planning, and performance reviews
To create and edit Tableau Next dashboards and view Marketplace templates:
Tableau Unmetered Platform Analyst or Tableau Next Platform Analyst permission set
The template is designed to work with an existing semantic model and its metrics to quickly
show your performance data in a layout optimized for embedding. Or you can skip the data
configuration steps, and just use the selected layout to add your own semantic model and
metrics. For more information about creating models and metrics, see Create Semantic Models and Define Metrics.
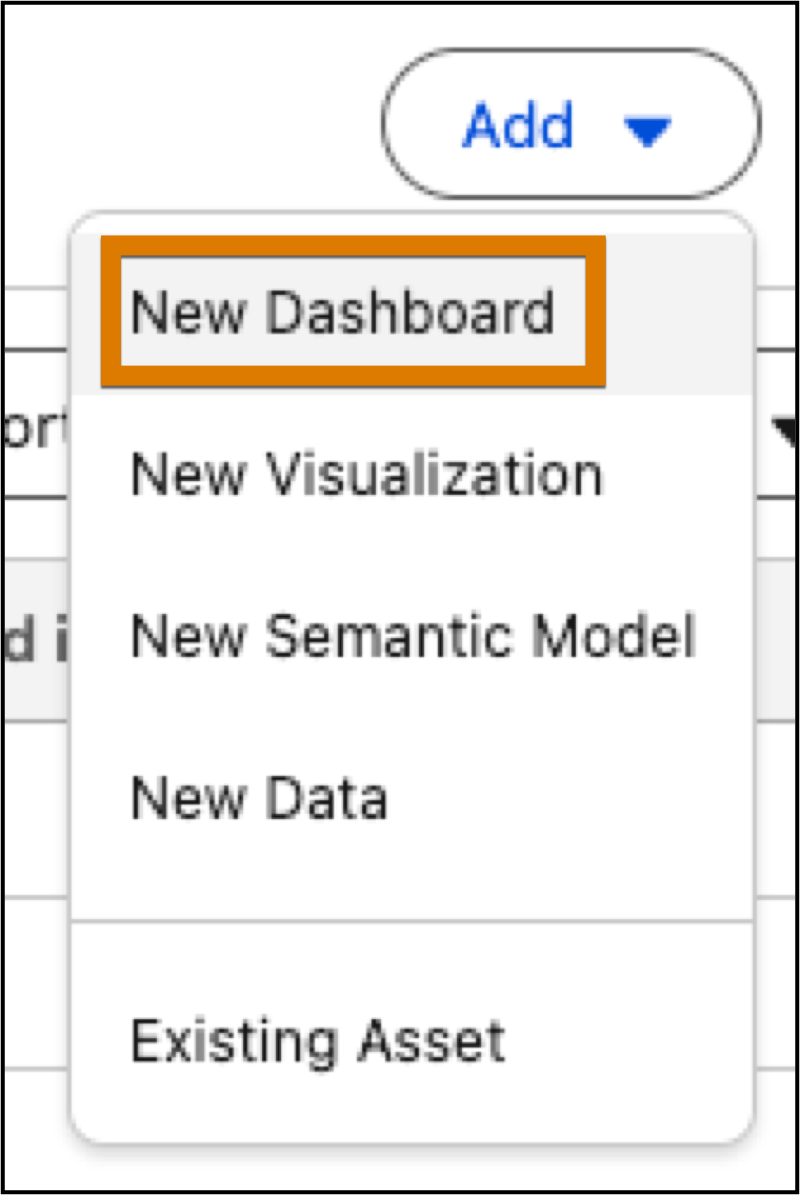
From a workspace, click Add and select New
Dashboard.
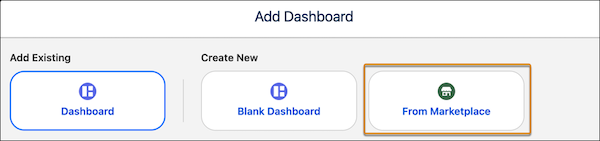
To view dashboard templates, select From Marketplace.
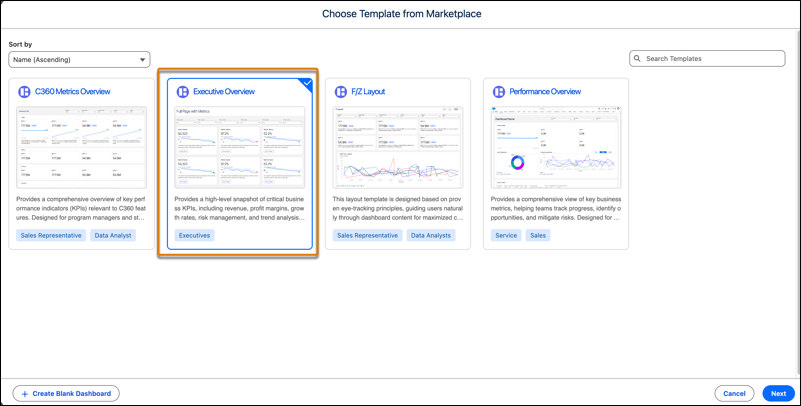
In the Marketplace, select the Executive Overview template tile, and click
Next.
Select the layout for your dashboard and click Next.
Use full page if you're embedding the dashboard in a tab. For embedding into a record
page, use compact horizontal or compact vertical. These layouts create dashboards optimized for
viewing in headers, footers, or side panels.
Configure your data selections and click Next.
You can use your own semantic model or skip this step if you don’t have a semantic model
yet.
To use an existing semantic model, select the model. The selected model is used to
populate the remaining configuration questions.
Select up to 5 data fields to use as dashboard filters.
Configure any dashboard details to fine-tune your charts and breakdowns. Then, click
Create Dashboard.
All selections are optional and can be skipped.
Select up to 6 metrics.
Each metric has a drill-down detail page.
Select a dimension to use in the line chart.
Select a dimension to use for grouping the donut chart.
Select a second dimension to use for grouping the bar chart.
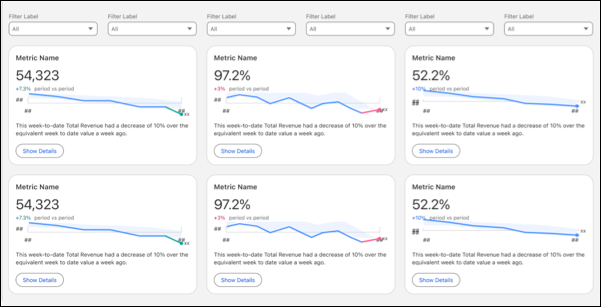
Example
A executive overview dashboard with the full page layout.
The template generates the dashboard with your configurations, displaying the installation
progress. You can close this window at any time; the dashboard installation continues in the
background. After installation is complete, give the dashboard a name, make any edits you want,
and then save it to your workspace. If you closed the progress window, on completion, a success
message with a link to the dashboard displays.
Did this article solve your issue?
Let us know so we can improve!
Loading
Salesforce Help | Article
Cookie Consent Manager
General Information
Required Cookies
Functional Cookies
Advertising Cookies
General Information
We use three kinds of cookies on our websites: required, functional, and advertising. You can choose whether functional and advertising cookies apply. Click on the different cookie categories to find out more about each category and to change the default settings.
Privacy Statement
Required Cookies
Always Active
Required cookies are necessary for basic website functionality. Some examples include: session cookies needed to transmit the website, authentication cookies, and security cookies.
Functional Cookies
Functional cookies enhance functions, performance, and services on the website. Some examples include: cookies used to analyze site traffic, cookies used for market research, and cookies used to display advertising that is not directed to a particular individual.
Advertising Cookies
Advertising cookies track activity across websites in order to understand a viewer’s interests, and direct them specific marketing. Some examples include: cookies used for remarketing, or interest-based advertising.