
You are here:
Forecasting with Tableau Next
Apply forecasting models on historical data to predict future outcomes that guide business decisions. You can choose the forecasting model to use, set how far ahead to forecast, and define the time range to base forecasts on. You can add forecasting to up to three measures in a single visualization. All selected measures use the same forecast settings, such as model type, duration, and prediction interval.
Required Editions
| View supported editions. |
This table includes a description of the settings available with forecasting in Tableau Next.
Visualize Future Trends with Forecasting
In Tableau Next, you can add forecasts to charts that contain a date value and one or more measures. Project sales for multiple segments of the same metric in a single chart, or related metrics across distinct charts within one visualization. For example, create a visualization with projected total sales orders in one line chart, and include another chart that breaks down the sales forecast by segment for a more targeted comparison.
Required Editions
| View supported editions. |
| User Permissions Needed | |
|---|---|
| To add forecast data in a Tableau Next visualization: | Tableau Unmetered Platform Analyst or Tableau Next Platform Analyst permission set |
- In a chart visualization, from the Data pane, drag the Order Date field onto Columns.
- From the Order Date menu, click Date Value and choose a time interval, such as Quarter.
- From the Data pane, drag Sales onto Rows.
- In the Analytics section, drag Sales onto Forecast.
- Optionally, to visually differentiate forecast lines by segment in the same chart, drag Segment onto Color.
-
To adjust forecasting settings, click Forecast.
- Select a forecasting model to apply.
- Set the forecast length to specify how far the projection extends.
- To fill missing data points with zeroes, select Replace missing values with zeroes. Otherwise, leave it unchecked.
- To show the range of likely values as a shaded area around the forecast line, select Show prediction intervals.
- Set the percentage value for the shaded area.
- Click Apply.
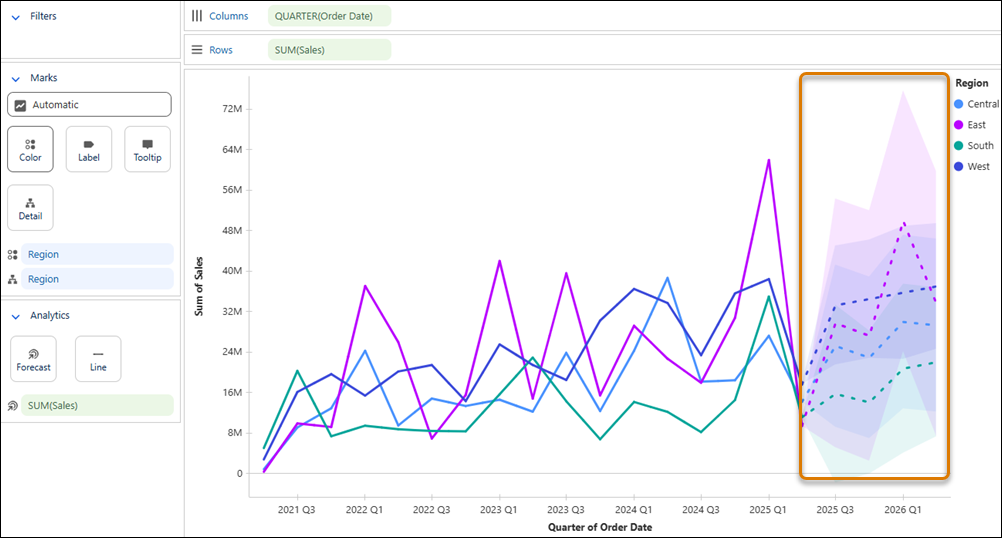
Tableau Next Forecasting: Limitations
Review these limitations before applying forecasting to Tableau Next visualizations.
- Forecasting supports Date Values only.
- Forecasting isn’t supported on charts that include reference lines.
- Forecasting requires at least three data points at the aggregation and group levels you select. For example, you need at least three months of data for monthly forecasting or three years of data for yearly forecasting.