
You are here:
Set Up Log Streaming to Third-Party Monitoring Tools
For enterprise-scale monitoring and automation, stream logs from B2C Commerce to third-party analytics platforms, including Splunk, Datadog, Grafana Loki, New Relic, Dynatrace, SumoLogic, and AWS Elastic Cloud. You can also use generic HTTP connections to stream logs to other tools.
- Log in to Log Center.
-
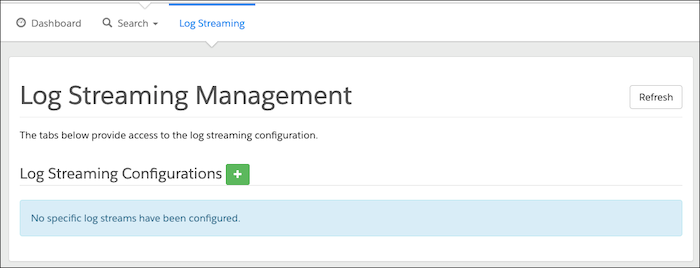
Select the Log Streaming tab.
-
Create a new log stream configuration by clicking
 next to Log Streaming
Configurations.
next to Log Streaming
Configurations.
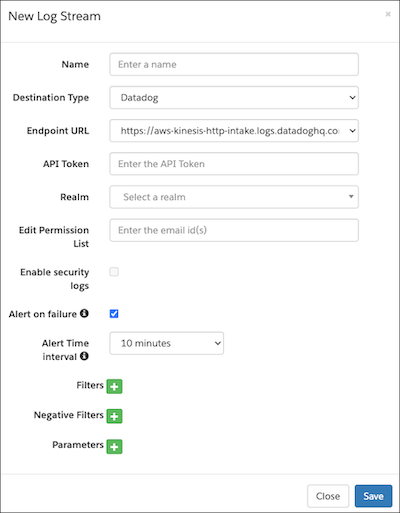
- Enter the log stream name. You can use alphanumeric and special characters with spaces. You can’t use the same name for multiple configurations.
- Select a destination type. The options include Datadog, Dynatrace, Elastic Cloud on AWS, Generic HTTP, Grafana Loki, New Relic, Splunk (cloud and enterprise), and SumoLogic.
-
Enter the third-party endpoint URL as the destination for the log.
- If you selected Grafana Loki for the destination, enter a user ID.
-
Enter the API token for the third-party tool.
Destination Type API Token Documentation Reference Splunk Authentication Token Splunk Add-on for Amazon Kinesis Firehose Datadog Authentication Keys Datadog API and Application Keys New Relic API Keys New Relic API Keys Grafana Loki Token Grafana Labs: Configure Logs with Firehose Dynatrace API Token Stream logs via Amazon Data Firehose SumoLogic Any Sumo Logic: AWS Kinesis Firehose for Logs Source AWS Elastic Cloud API Key Elastic: Monitor Amazon Web Services (AWS) with Amazon Data Firehose Generic HTTP Customized Authentication Not applicable. -
Select a realm, and then configure the number of streams.
For each realm, you can configure up to 5 streams per destination type.
-
(Optional) For Edit Permission List, enter a comma-separated list of email IDs for
the users who have edit access. There’s no limit to the number of email IDs that you
can enter. Note these guidelines.
- The user who configures the log stream is the primary owner.
- The primary owner can enable, edit, and delete permissions for other users assigned to the same realm.
- Invalid or incorrect email addresses are ignored.
- Users assigned to the same realm can view the realm but don’t have edit or delete permissions.
-
(Optional) Set filters. Next to Filters, click .
Enter the filter field values exactly as shown in the table, or the parameters are ignored.
- Use the OR operator for multiple values of a single filter type.
- Use the AND operator for multiple filter types.
- You can’t configure filters and negative filters for the same type.
- Each row represents one filter type. If you configure multiple rows with the same type, they’re combined.
Types Description Example Category Logs category type from search aggregation. Enter a comma-separated list of values. - Category Type
- system
- custom
- customfiles
- Jdbc
- syslog
- api
- job
- staging
- sysevent
- analytics
- quota
- deprecation
- impex
- batch
- migration
Request Logs request type from search aggregation. Enter a comma-separated list of values. - Request Type
- JOB
- BUSINESSMGR
- STOREFRONT
- TEMPORARY
- REST
Service Logs service type from search aggregation. Enter a comma-separated list of values. - Service Type
- ecom
- JWA
- MRT
Severity Logs severity from search aggregation. Enter a comma-separated list of values. - Severity
- info
- warn
- error
- debug
- fatal
Tenant Name Logs tenant name ID from search aggregation. Enter a comma-separated list of values. - Tenant Name
- production.functional09.qa222 bgzz_prd
- dev02.functional09.qa222 bgzz_s02
- dev04.functional09.qa222 bgzz_s04
Tenant Type Logs tenant type from search aggregation. Enter a comma-separated list of values. - Tenant Type
- sbx
- prd
- stg
- dev
-
(Optional) Set negative filters. Next to Negative Filters, click .
- Use the OR operator for multiple values of a single filter type.
- Use the OR operator for multiple filter types.
- You can’t configure filters and negative filters for the same type.
- Each row represents one filter type. If you configure multiple rows with the same type, they’re combined.
-
(Optional) Set parameters. Next to Parameters, click .
Use parameters to customize any extra HTTP header, which ends up as an X-Amz-Firehose-Common-Attributes header. For more information, see Amazon Data Firehouse request and response specifications..
- Grafana Loki parses HTTP header key with the prefix lbl_ into tags.
- Datadog parses HTTP header keys into tags.
- New Relic parses HTTP header key into attributes.
- Splunk and Dynatrace don’t support parameters
- Sumo Logic accepts _sourceCategory and _sourceName attributes for filtering.
- AWS Elastic Cloud accepts the parameters es_datastream_name, include_cw_extracted_fields, and . For more information see Monitor Amazon Web Services (AWS) with Amazon Data Firehose.
- Duplicate parameters aren’t combined.
- Save your configuration changes.
- Click Close.
- After you configure log your streaming, click Refresh, and check for any error messages.
Did this article solve your issue?
Let us know so we can improve!