Loading
Salesforce now sends email only from verified domains. Read More
About Salesforce Data 360
Table of Contents
Select Filters

          No results
          No results
          Here are some search tips

          Check the spelling of your keywords.
          Use more general search terms.
          Select fewer filters to broaden your search.

          Search all of Salesforce Help
          Binary Classification Metrics

          Binary Classification Metrics

          Metrics for binary classification help evaluate the performance of a model that categorizes data into two classes.

          Accuracy

          In addition to the overall accuracy score using AUC, there are two additional metrics for understanding the accuracy of a binary classification model.

          Model accuracy tile

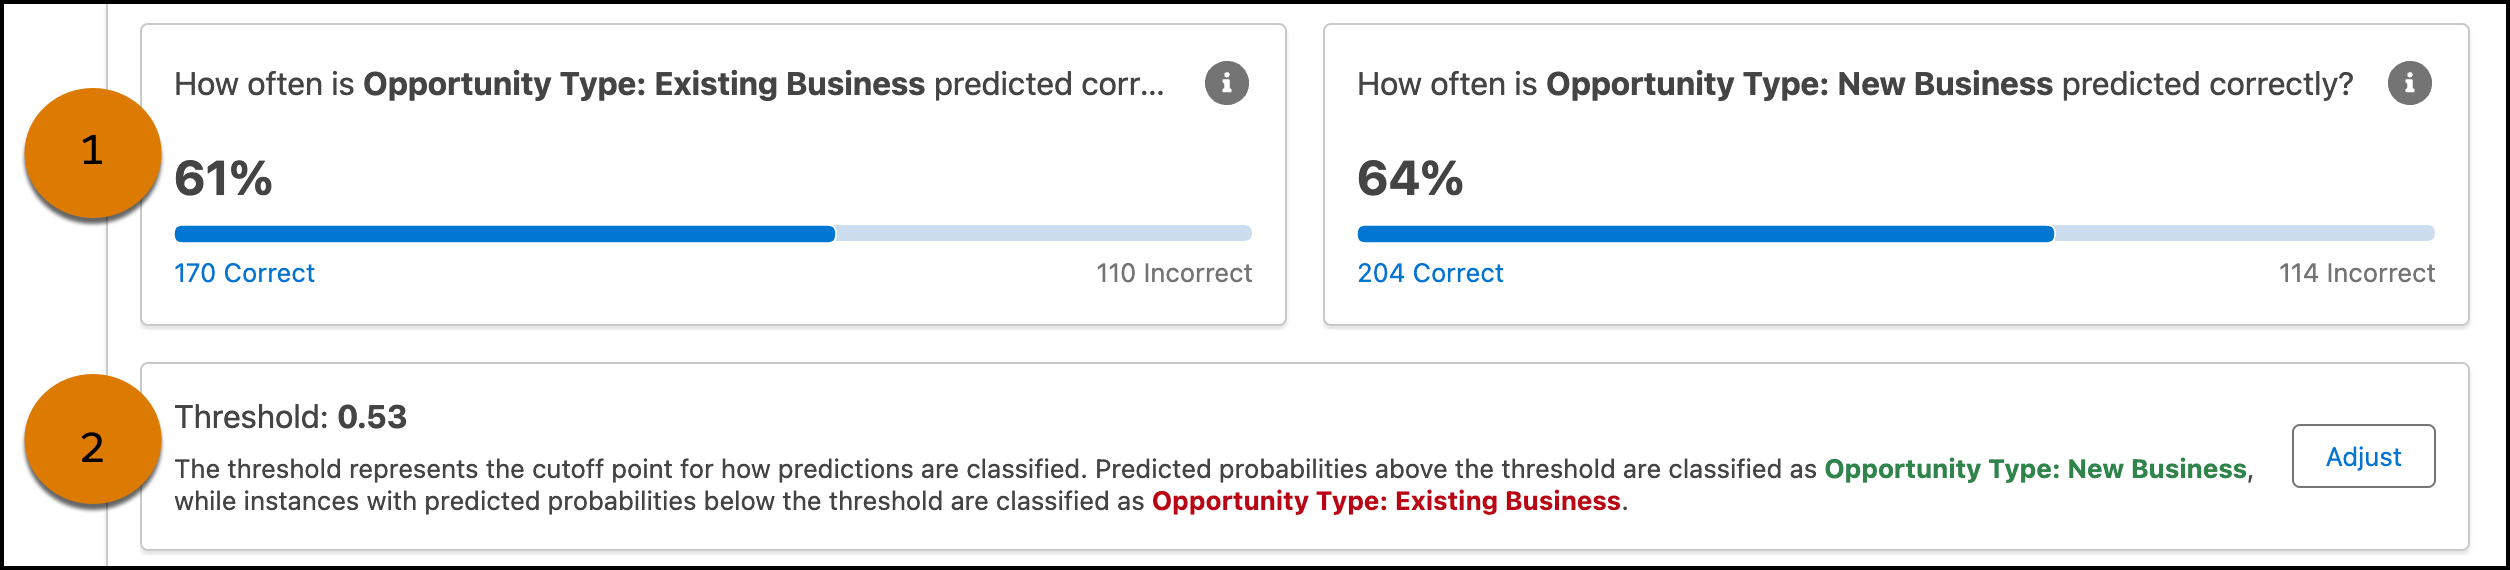
          View how often the model makes correct and incorrect predictions (1). See the threshold cutoff point for how predictions are classified between classes (2).
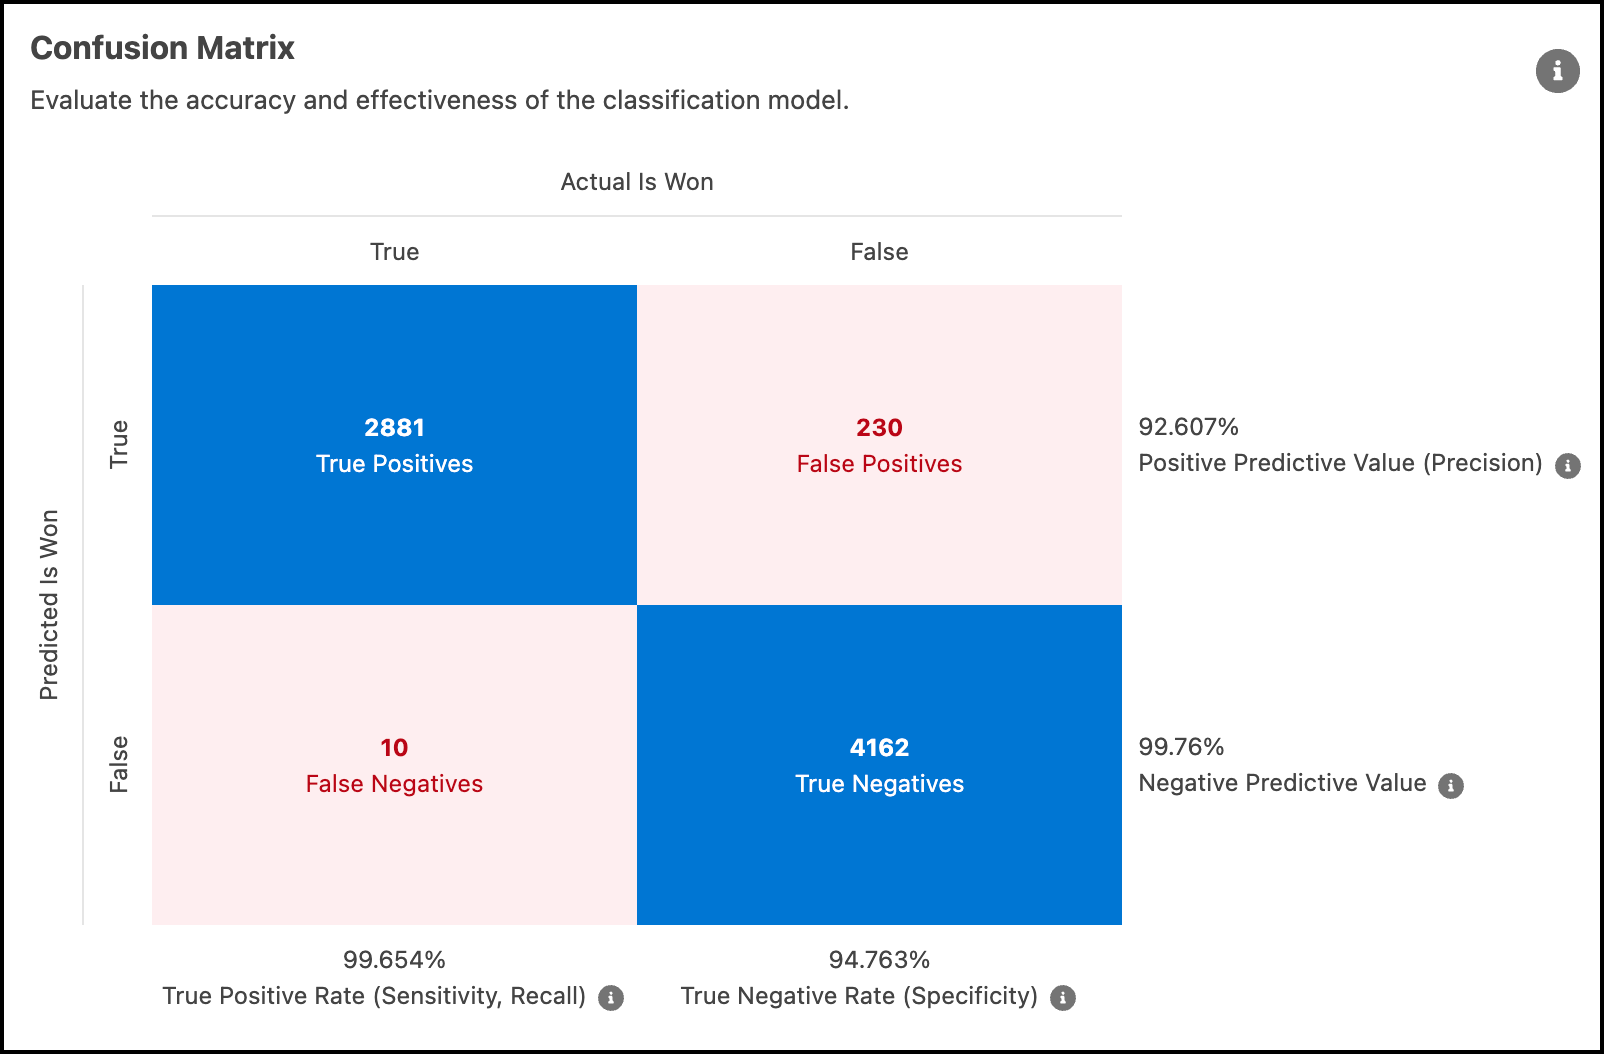
          Confusion Matrix

          Use the confusion matrix to evaluate the tradeoffs between different error types based on the threshold value. The chart displays how many times the model correctly and incorrectly classifies observations at the associated threshold.
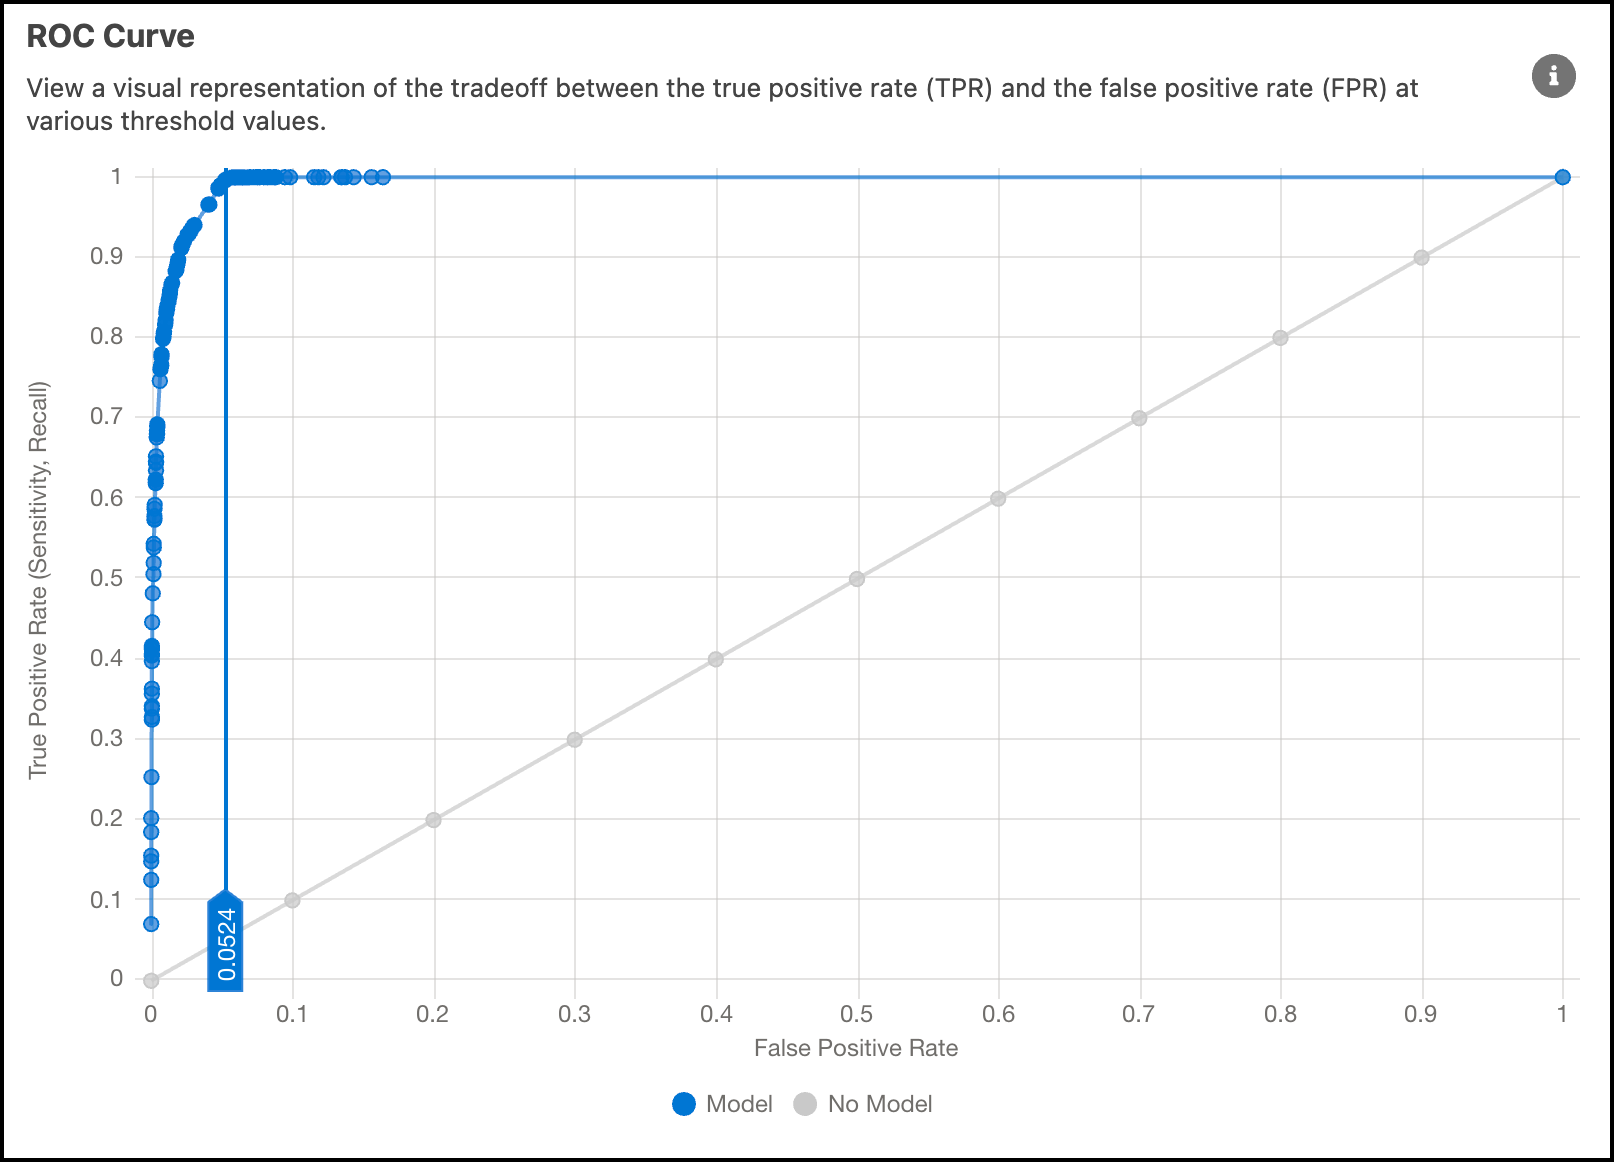
          Confusion matrix chart

          ROC Curve

          The Receiver Operating Characteristic (ROC) curve displays the performance measurement at various threshold settings. ROC is a probability curve and AUC (Area Under the Curve) quantifies the degree of separability. Use the chart to see how effectively the model can differentiate between classes.
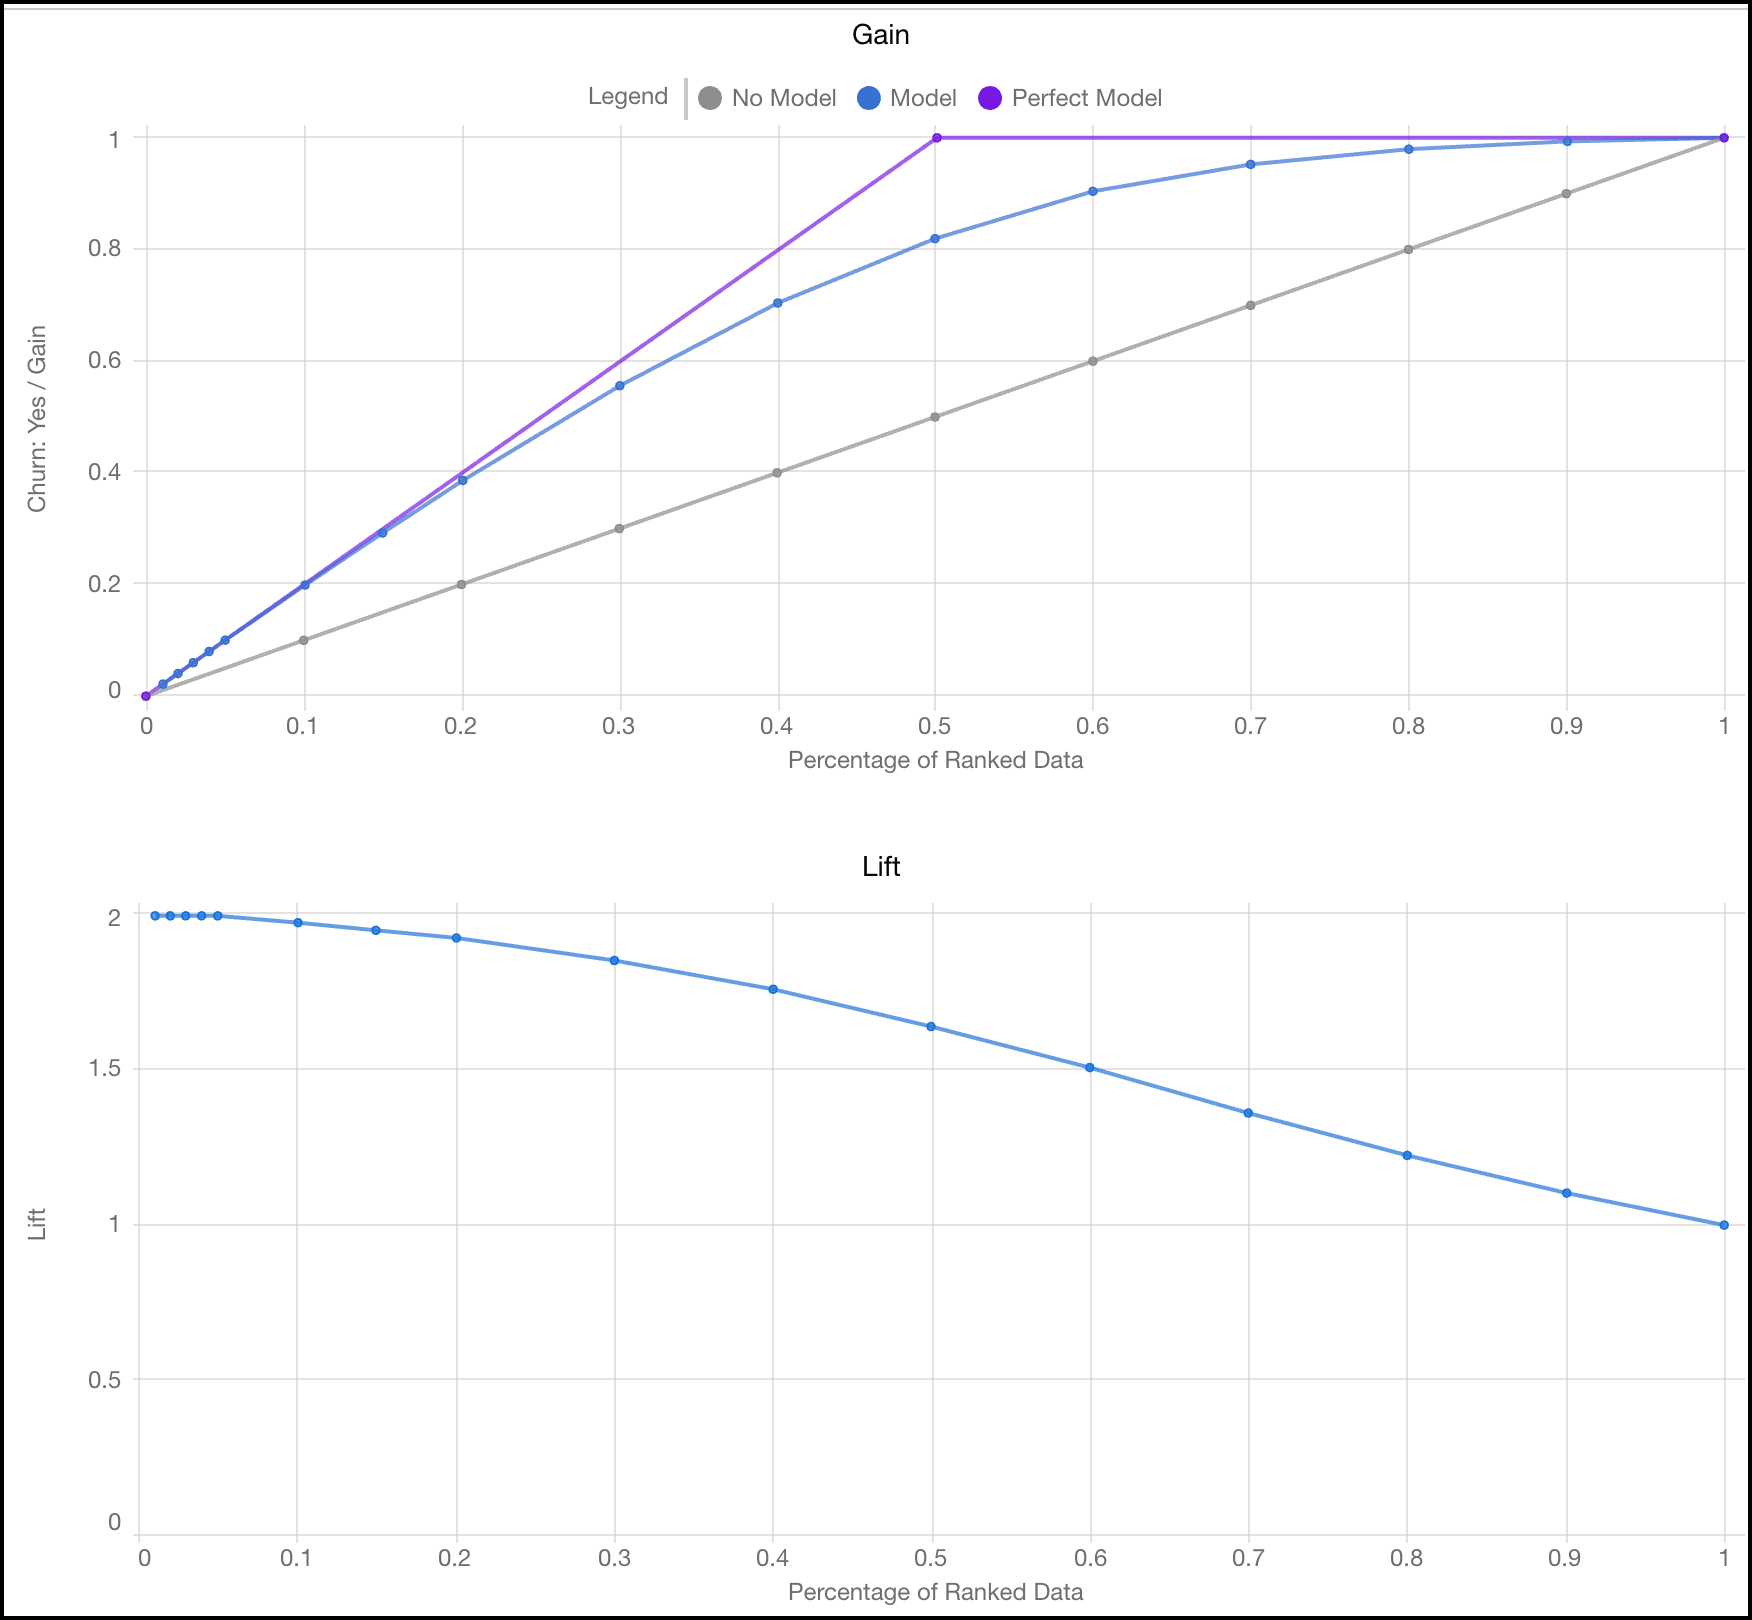
          ROC curve chart

          Gain and Lift

          Gain and Lift charts show the benefit of the model. Using a portion of the data that’s scored and ranked for analysis, the charts measure results obtained with the model compared to random guessing without a model. The greater the gain and the higher the lift, the more effective the model.

          ROC curve chart

          Chart Description
          Gain

          The gain chart plots the total positive rate, or gain, by percentage of the data. The closer the model line is to theoretical exactness (perfect model) and the further it is from random guessing (no model), the greater the gain. Gain can be used to prioritize your organization’s resources.

          For example, if a model has 80% gain at 20% of the data, then 80% of the target can be reached with the top 20% of the data.

          Lift

          The lift chart plots the improvement ratio, or lift, by percentage of the data. Better models have higher lifts.

          For example, if a model has 2.5 lift at 20% of the data, then results with the model are 2.5 times better in the top 20% of the data than without.

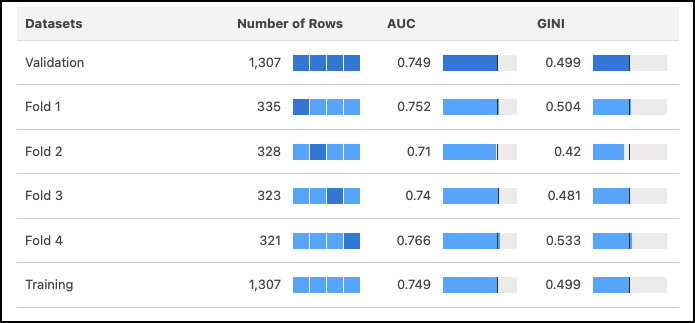
          4-Fold Cross Validation Results

          The 4-fold cross-validation approach mitigates sampling bias during the model validation process. In this method, the data is randomly divided into four separate partitions of equal size, and the model undergoes four test passes (folds). During each pass, three partitions serve as the training data, while the remaining one serves as the test data. By completing four test passes, each partition is used once as the validation data and three times as part of the training data, ensuring a comprehensive evaluation. Refer to the table of validation results to examine metrics corresponding to each fold of the data.

          Cross validation metrics table

          Metric Description
          Number of records

          Total number of observations. The meaning of a value varies per column.

          • For the Training Data and Validation Data columns, the numbers are the same. This value represents the total number of observations in the entire data used in the creation of the model.
          • For the Fold #1 through Fold #4 columns, this value represents how many observations fell in that fold (approximately 25% of the entire data).
          AUC

          The Area Under the Curve (AUC) represents the rate of correct classification by a logistic model.

          • 0.5 means that the model performs no better than random guessing.
          • 1.0 means that the model correctly classifies data 100% of the time, which can indicate data leakage.
          GINI The Gini Index quantifies how closely this logistic model performs to a theoretically best possible model.

          Other Metrics

          Consider other metrics that are commonly used to evaluate model quality.

          Metric Description
          Accuracy

          Accuracy measures the proportion of outcomes that the model predicted correctly (true positives and true negatives).

          • Use to evaluate the overall classification performance of a model.
          • The range is from 0 to 1, with a higher value indicating better performance.
          • It's calculated as (True Negative+True Positive)/(True Negative+False Negative+True Positive+False Positive).
          F1 Score

          F1 score is the harmonic average of the positive predictive value (precision) and the true positive rate (recall).

          • Use to evaluate the overall performance of a binary classification model, particularly when it's equally important to minimize false positives and false negatives.
          • The range is from 0 to 1, with a higher value indicating better performance.
          • It’s calculated as 2*(Positive Predicted Value*True Positive Rate)/(Positive Predicted Value+True Positive Rate).
          False Negatives The number of predicted negatives that are actually positive.
          False Negative Rate

          False Negative Rate (FNR, also called type II error or miss rate) is the proportion of predicted false negatives among all the actual positives.

          • Use to evaluate how often a classification model incorrectly classifies positives as negatives, or when it's important to minimize false negative errors.
          • The range is from 0 to 1, with a lower value indicating better performance.
          • It's calculated as False Negative/(False Negative+True Positive).
          False Positives The number of predicted positives that are actually negative.
          False Positive Rate

          False Positive Rate (FPR, also called type I error, false alarm ratio, or fallout) is the number of predicted false positives among all the actual negatives.

          • Use to evaluate how often a classification model incorrectly classifies negatives as positives, or when it's important to minimize false positive errors.
          • The range is from 0 to 1, with a lower value indicating better performance.
          • It's calculated as False Positive/(False Positive+True Negative).
          Informedness

          Informedness (also called Youden's J statistic) measures how well the model predicts both positives and negatives.

          • Use to evaluate the overall performance of a binary classification model, particularly when it's equally important to classify true positives and true negatives.
          • The range is from -1 to 1, with 1 indicating perfect performance, 0 indicating random performance, and -1 indicating perfect inverse performance.
          • It's calculated as True Positive Rate+True Negative Rate-1.
          Markedness

          Markedness measures the trustworthiness of positive and negative predictions by the model.

          • Use to evaluate the overall performance of a binary classification model, particularly when it's important to separately assess the performance for positives and negatives.
          • The range is from -1 to 1, with 1 indicating perfect performance, 0 indicating random performance, and -1 indicating perfect inverse performance.
          • It's calculated as Positive Predicted Value+Negative Predicted Value-1.
          MCC

          The Matthews Correlation Coefficient (MCC) provides a more even representation of the four parts of the confusion matrix than other metrics.

          • Use to evaluate overall performance, particularly when there's imbalanced data.
          • The range is from -1 to 1, with 1 indicating perfect performance, 0 indicating random performance, and -1 indicating perfect inverse performance.
          • It's calculated as (True Positive*True Negative-False Positive*False Negative )/square root((True Positive+False Positive)*(True Positive+False Negative)*(True Negative+False Positive)*(True Negative+False Negative)).
          Negative Predictive Value

          Negative Predictive Value (NPV) is the proportion of actual negatives among all the predicted negatives.

          • Use to evaluate how well a classification model predicts negative instances, or when it's important to minimize false negatives.
          • The range is from 0 to 1, with a higher value indicating better performance.
          • It's calculated as True Negative/(True Negative+False Negative).
          Positive Predictive Value (Precision)

          Positive Predictive Value (PPV, also called precision) is the proportion of actual positives among all the predicted positives.

          • Use to evaluate how well a classification model predicts positive instances, or when it's important to minimize false positives.
          • The range is from 0 to 1, with a higher value indicating better performance.
          • It's calculated as True Positive/(True Positive+False Positive).
          True Negatives The number of predicted negatives that are actually negative.
          True Negative Rate (Specificity)

          True Negative Rate (TNR, also called specificity) is the proportion of predicted negatives among all the actual negatives.

          • Use to evaluate how often a classification model correctly classifies negatives, or when it's important to correctly identify negative instances.
          • The range is from 0 to 1, with a higher value indicating better performance.
          • It's calculated as True Negative/(True Negative+False Positive).
          True Positives The number of predicted positives that are actually positives.
          True Positive Rate (Sensitivity, Recall)

          True Positive Rate (TPR, also called sensitivity or recall) is the proportion of predicted positives among all the actual positives.

          • Use to evaluate how often a classification model correctly classifies positives, or when it's important to correctly identify positive instances.
          • The range is from 0 to 1, with a higher value indicating better performance.
          • It's calculated as True Positive/(True Positive+False Negative).
           
          Loading
          Salesforce Help | Article