
You are here:
Regression Metrics
Metrics for regressions help evaluate the performance of a model that predicts numerical values for continuous data.
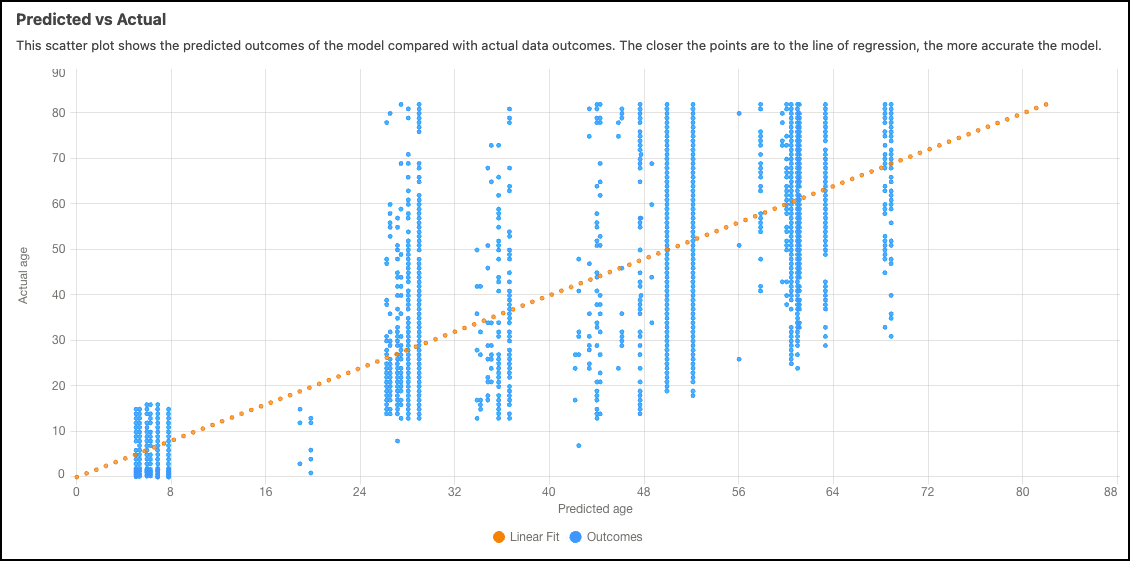
Predicted vs Actual
The predicted vs actual scatter plot contrasts the predicted results of the model against the actual data results. The proximity of the points to the diagonal line indicates the accuracy of the model, with closer points representing higher accuracy.
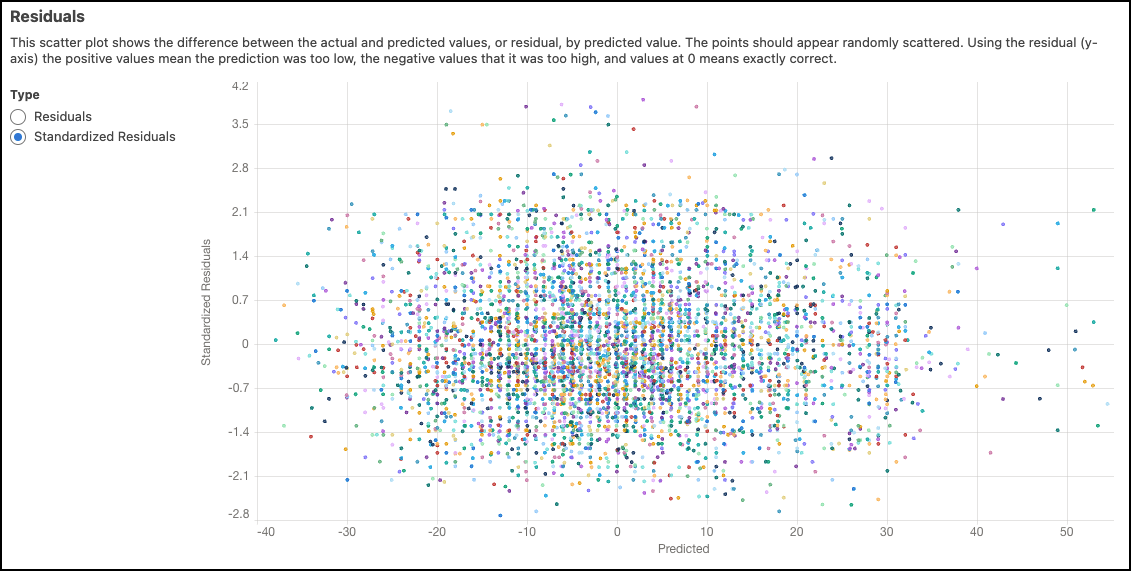
Residuals
The scatter plot of residuals shows the variance between the actual and predicted values, known as residuals, in relation to predicted values. Ideally, the points should appear randomly scattered. On the y-axis, positive values indicate predictions that were too low, negative values indicate predictions that were too high, and values at zero indicate predictions that were exactly correct.
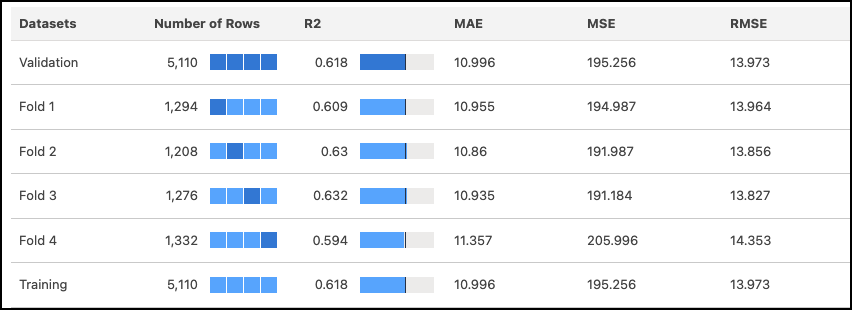
4-Fold Cross Validation Results
The 4-fold cross-validation approach mitigates sampling bias during the model validation process. In this method, the data is randomly divided into four separate partitions of equal size, and the model undergoes four test passes (folds). During each pass, three partitions serve as the training data, while the remaining one serves as the test data. By completing four test passes, each partition is used once as the validation data and three times as part of the training data, ensuring a comprehensive evaluation. Refer to the table of validation results to examine metrics corresponding to each fold of the data.
| Metric | Description |
|---|---|
| Number of records | Total number of observations. The meaning of a value varies per column.
|
| R2 | R2 measures the model's ability to explain variation in the outcome, which is an indicator of how predictive the model is. Range:
|
| MAE | Mean Absolute Error. Measures the absolute difference between the actual value and the prediction. All differences are weighted equally in this average, which means that it is not as sensitive to outliers as MSE. |
| MSE | Mean Squared Error. Measures the average squared error of the model’s predictions. MSE computes the square difference between the observed (actual) outcome and the predicted values, and then averages them. |
| RMSE | Root Mean Squared Error. Represents the square root of MSE. RMSE measures the difference between the values predicted by the model and the observed (actual) values. You can think of this value as the “standard deviation of errors.” |