
You are here:
Drift Monitoring (Beta)
Use Drift Monitoring in Data 360 to track predictive model degradation, which occurs when the distribution of model predictions changes significantly over time. Drift indicates shifts in customer behavior, business conditions, or underlying data patterns.
Use drift monitoring in Data 360 to track these two types of drift across active binary and regression models.
Variable Drift
Variable drift occurs when the distribution of live input data shifts away from training data. For example, a lead scoring model trained on email and organic search leads drifts when a new campaign suddenly drives most leads from social media.
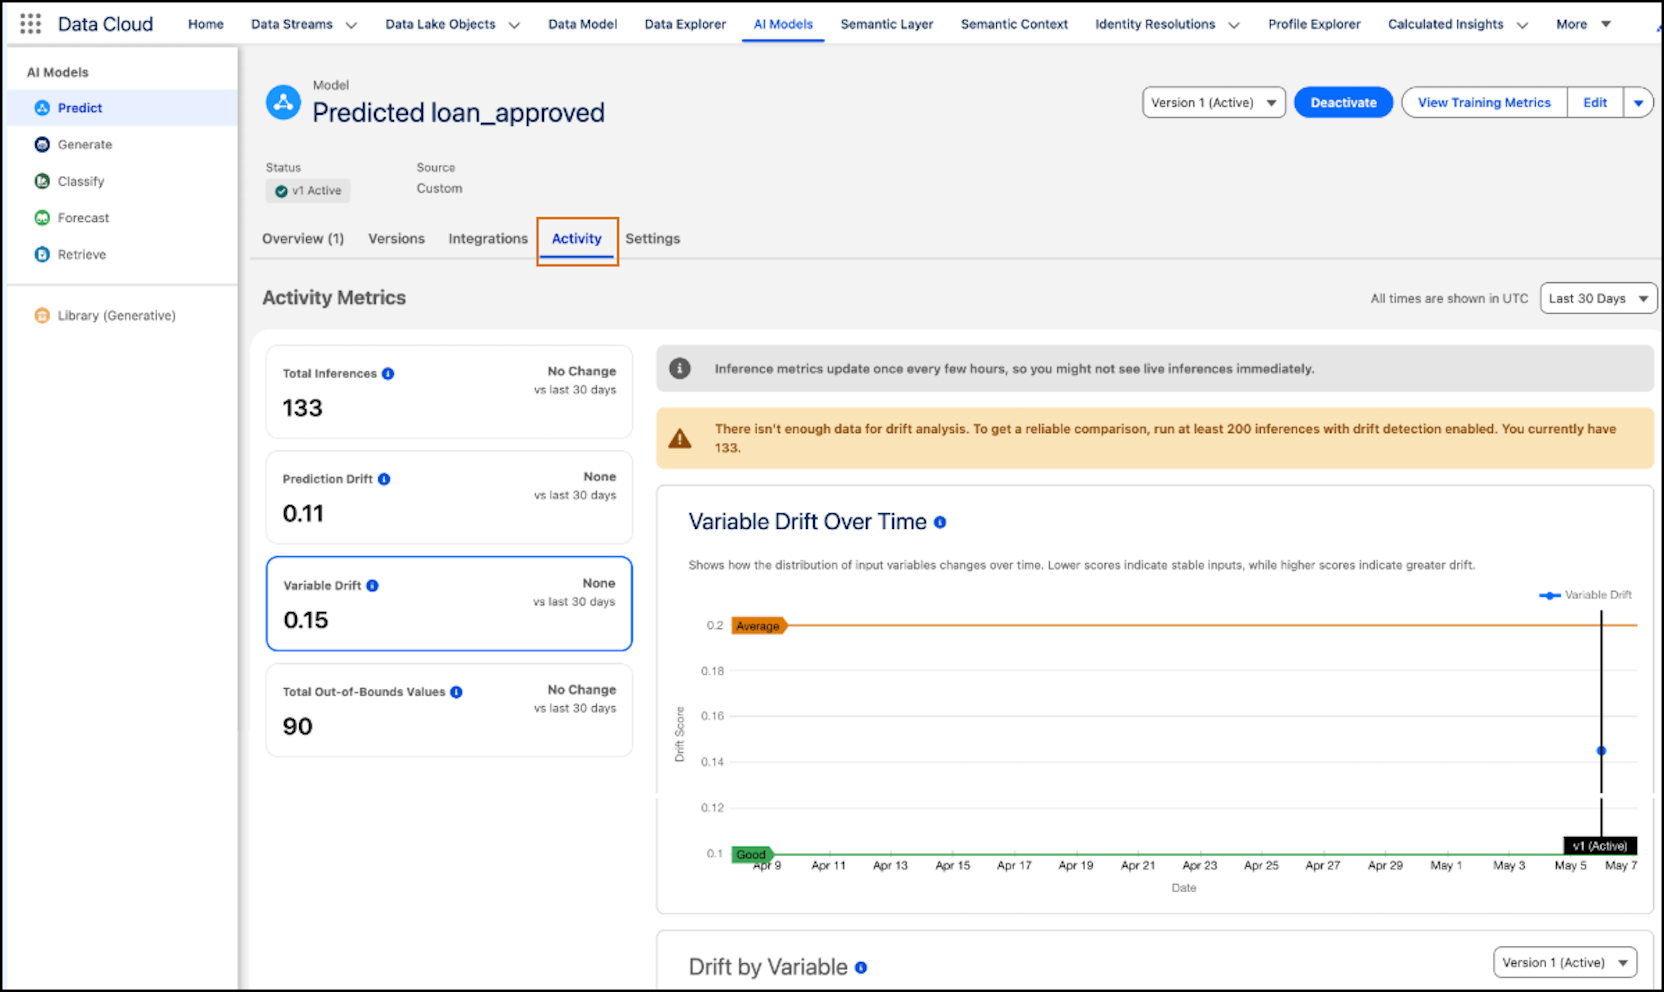
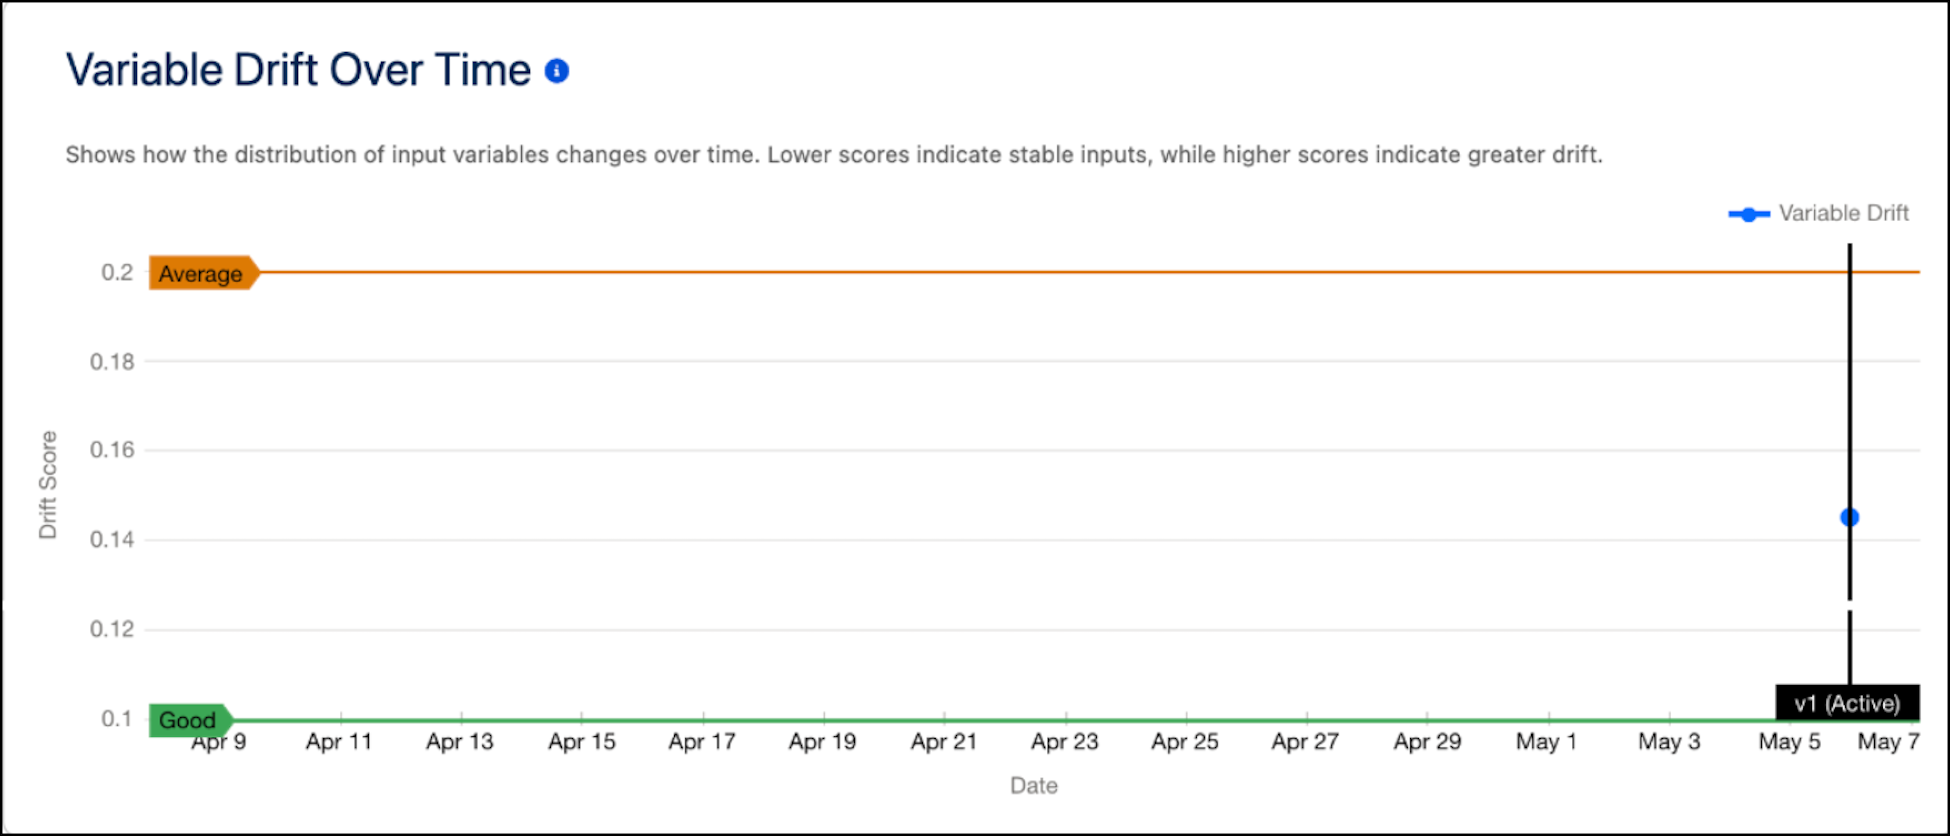
The Variable Drift Over Time chart visualizes how the distribution of input variables changes over time. Lower scores indicate stable input data, while higher scores indicate greater drift that can affect model performance.
The Drift by Variable chart visualizes drift scores across input variables to help identify which variables contribute most to overall drift. Lower scores indicate stable input data, while higher scores indicate greater drift that can affect model performance.
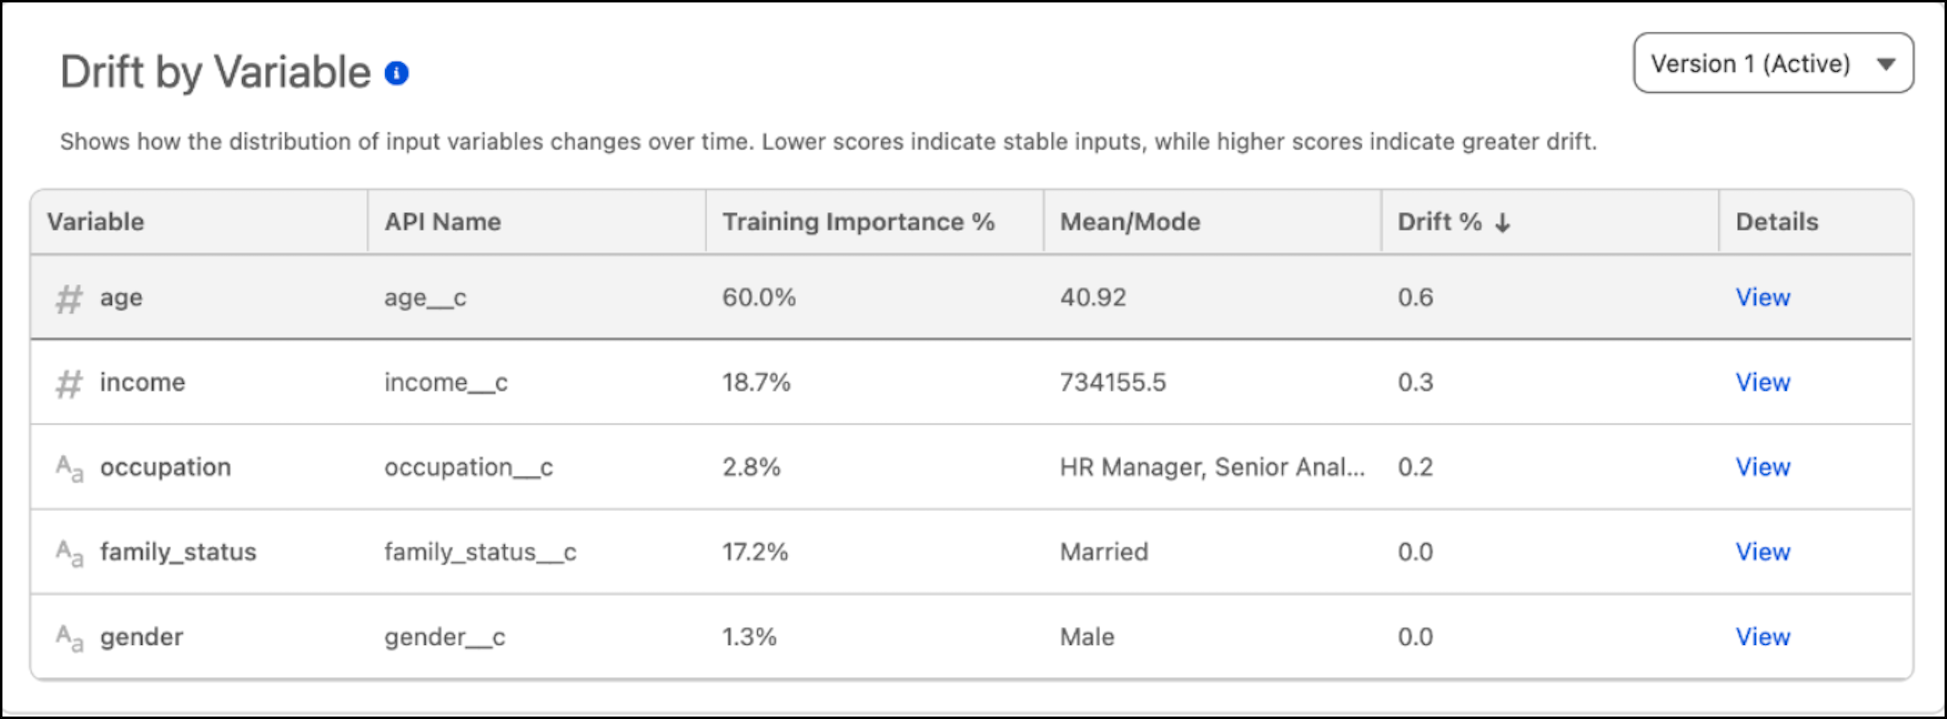
To investigate a specific variable, view the variable-level breakdown and open the variable-specific drift chart.
Prediction Drift
Prediction drift occurs when the distribution of predictions changes significantly over time, which can indicate shifts in customer behavior, business conditions, or underlying data patterns.
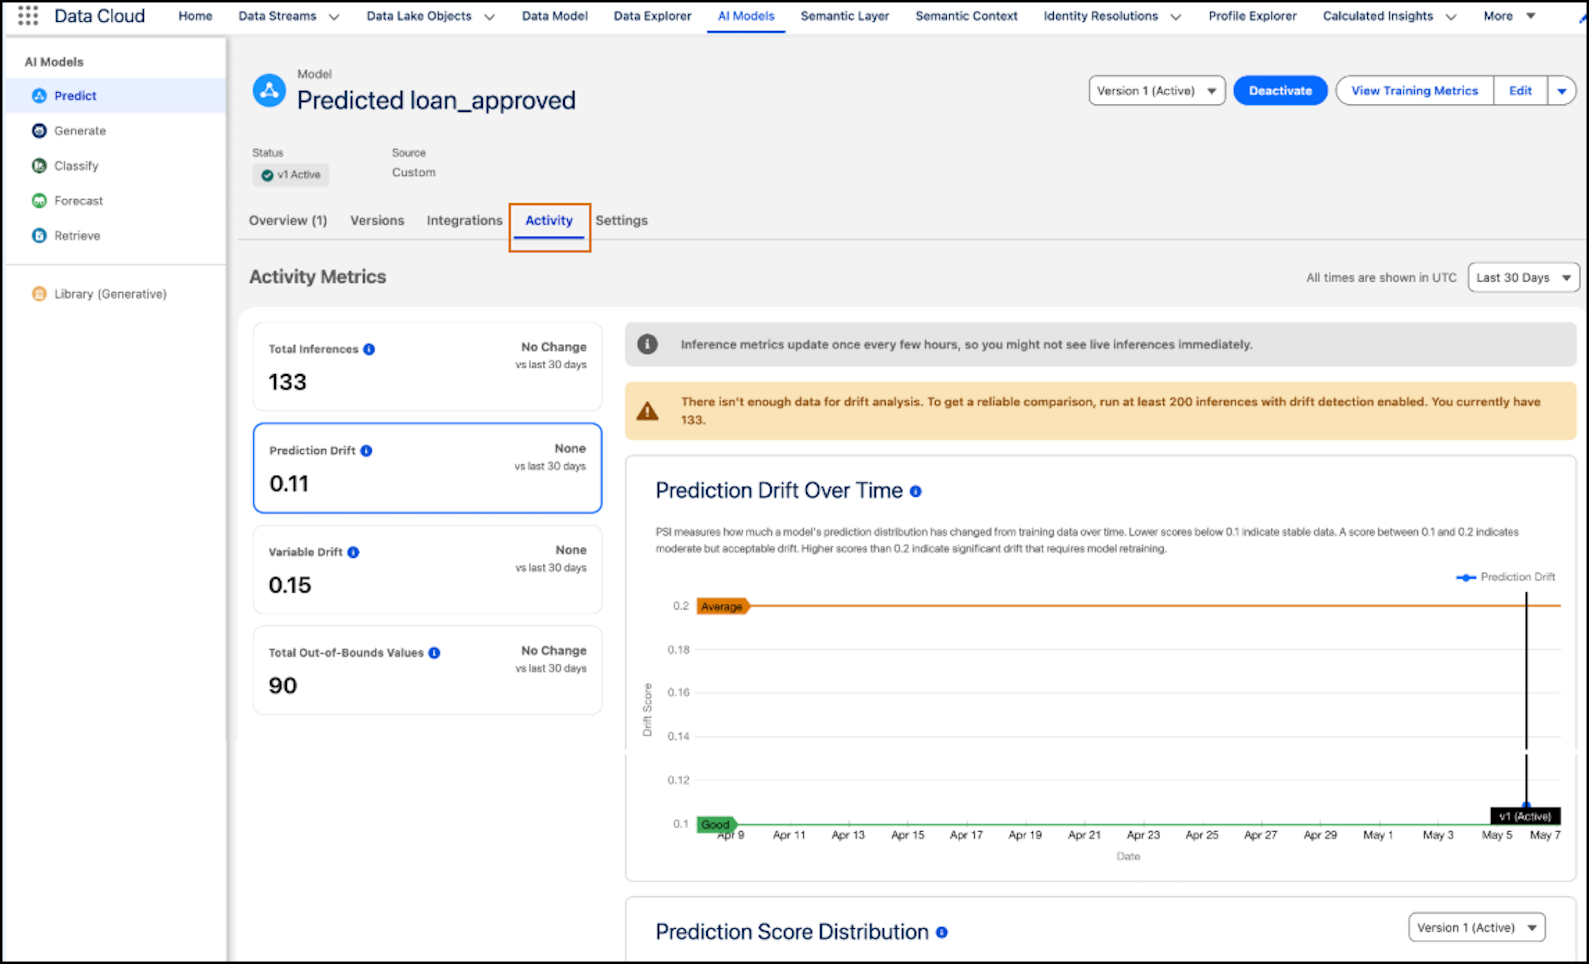
The Prediction Drift Over Time chart shows how model prediction distributions change over time. Lower scores indicate stable predictions, while higher scores indicate greater drift and potential shifts in underlying data patterns.
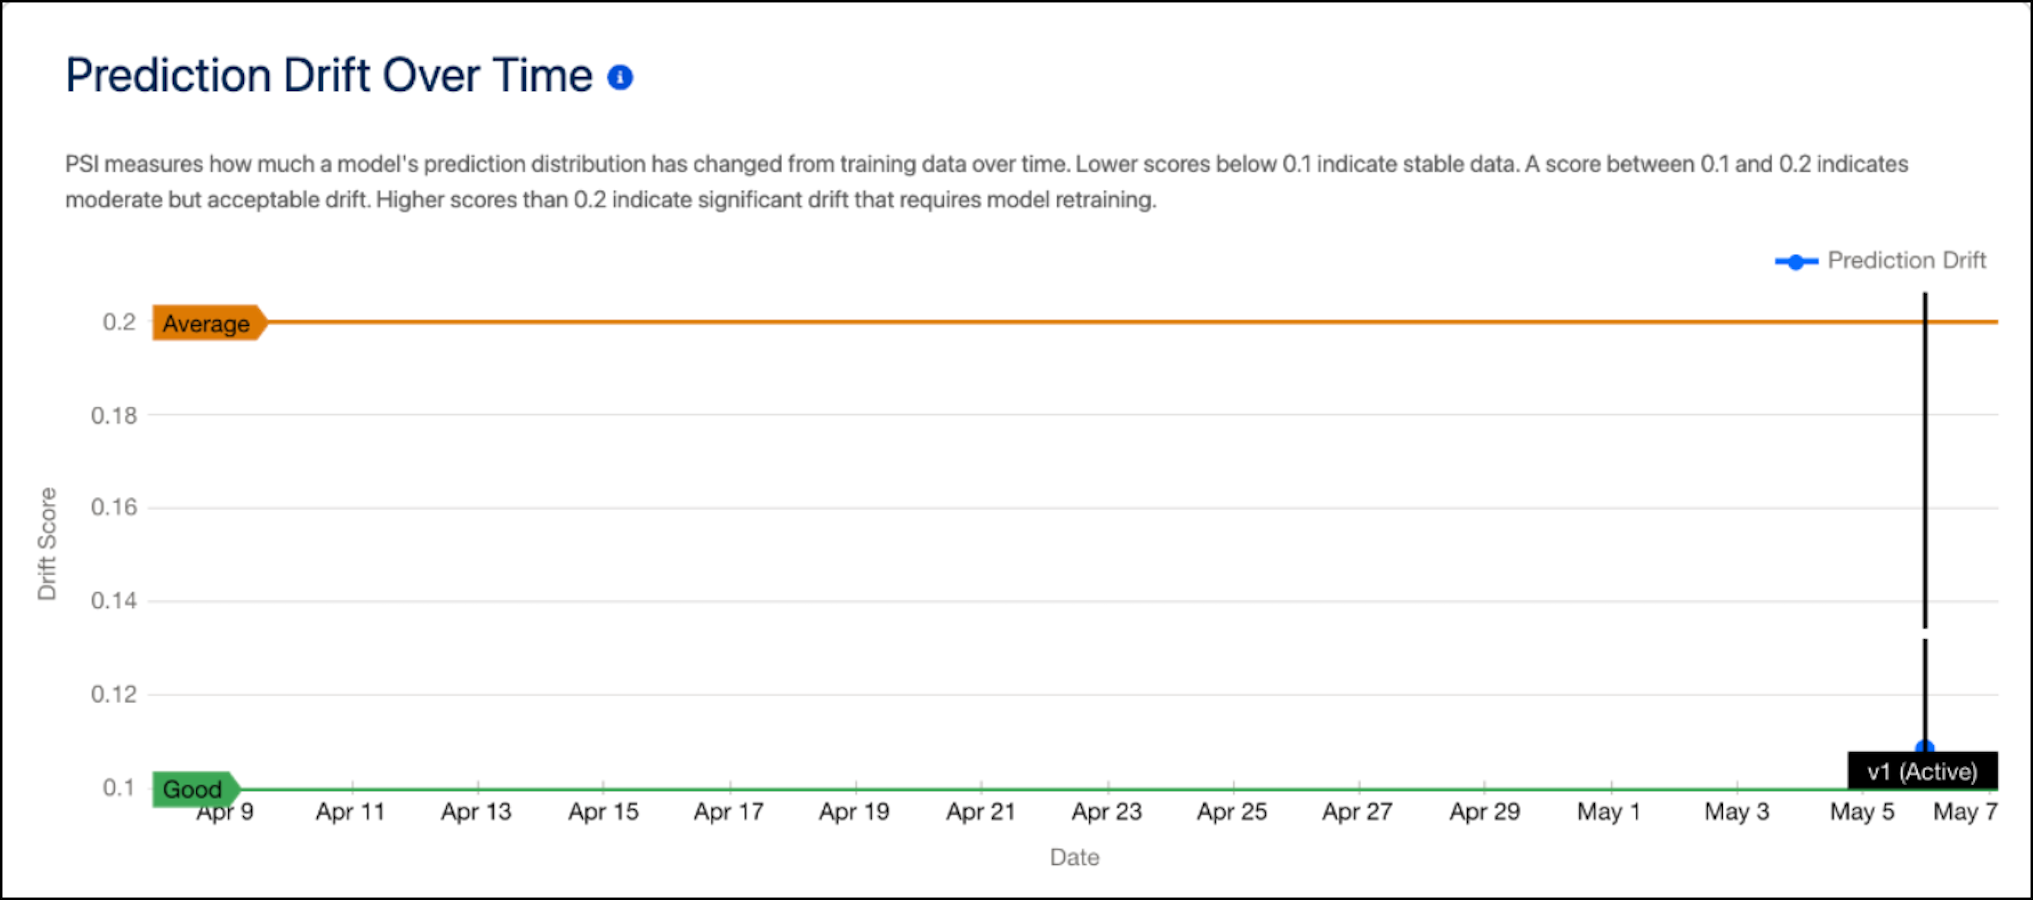
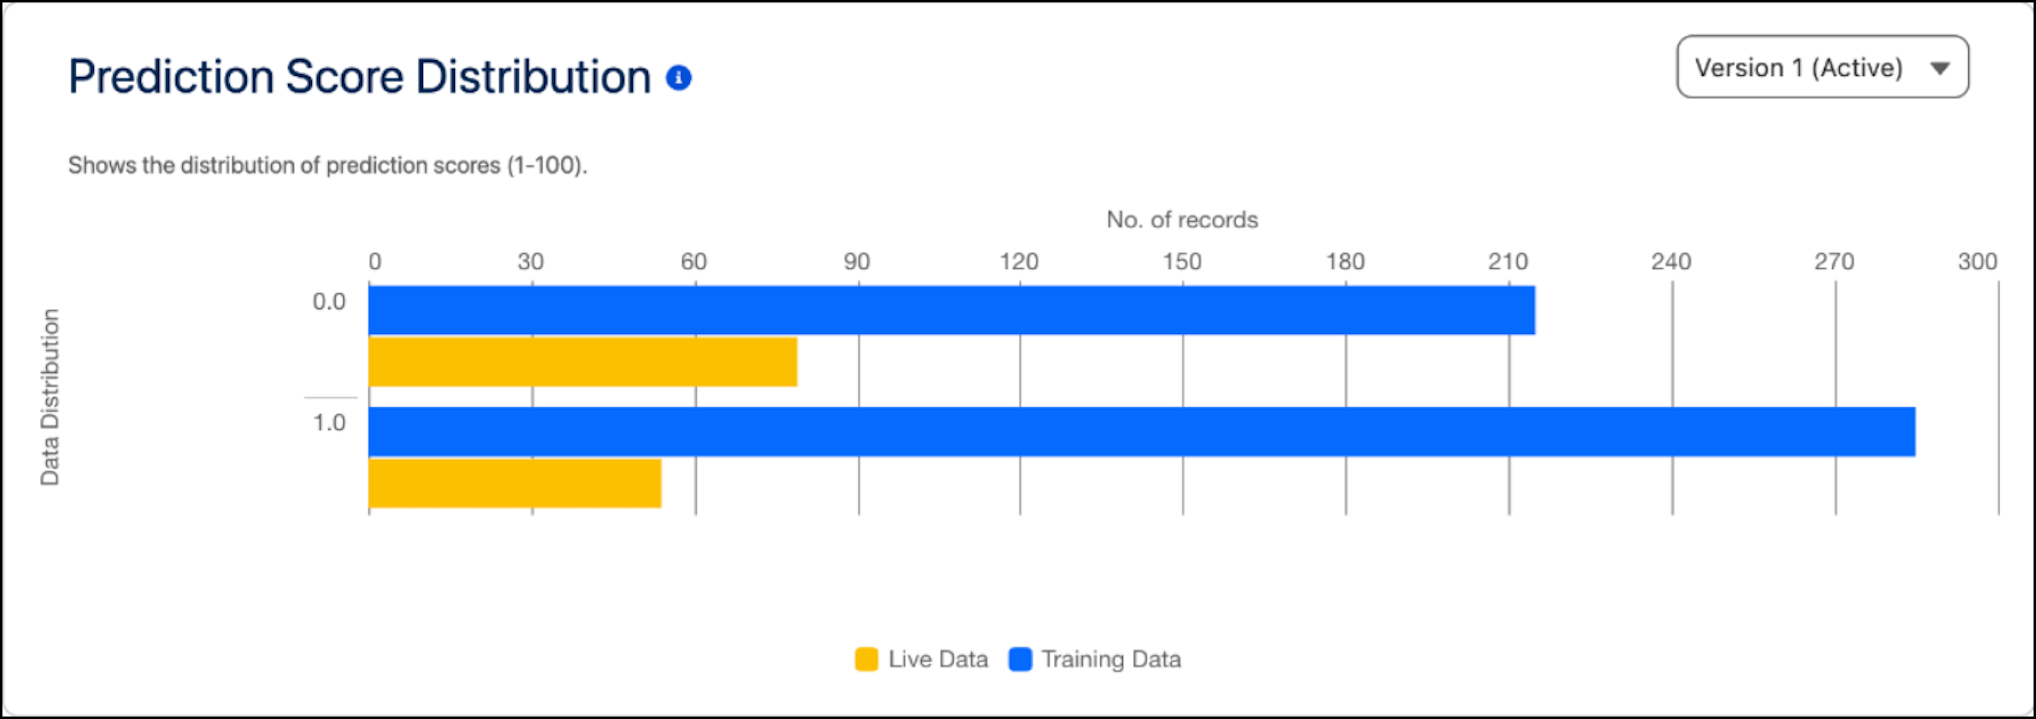
The Drift Score Distribution chart shows the distribution and frequency of prediction drift scores across inference runs. Rising drift scores indicate reduced model reliability and signal the need for retraining. To identify whether drift occurs only during specific periods or consistently increases over time, use this chart.
| STATUS | SCORE RANGE |
|---|---|
| Stable Drift | 0.0–0.1 |
| Moderate Drift | 0.1–0.2 |
| Significant | >= 0.2 |
Model Drift for an Activated Model
To monitor changes in an activated model, review its drift metrics in the AI Models tab in Data 360. The drift dashboard shows cards for variable drift and prediction drift. To track model changes over time, assess these metrics by day, week, or month.
Each drift card shows these details:
-
Current drift score and status — stable, moderate, or significant drift
-
Trend indicator that shows whether drift is increasing or decreasing
-
Version markers on the trend chart that indicate when a new model version was activated
Model Retraining
When drift scores reach the moderate or significant range, retrain the model to align it with current data patterns. To address the drift, train the model by using an updated dataset, and then activate the new version. Activation updates the drift baseline to reflect the new training data and adds version markers to the drift trend charts.
Model Considerations
-
Drift monitoring is available for binary and regression models and for Flow or API-based inferences only.
-
Make sure that at least one inference job is running.
-
An org can compute drift across all active inference jobs for a model. If a model has multiple inference jobs, drift scores reflect aggregated data across all jobs.
-
Basic drift charts are available at no additional cost. Deeper analysis by inference job or inference channel is a paid feature that consumes Data 360 credits.