
You are here:
Aggregate Node: Hierarchical Aggregation
Use Hierarchical Aggregation to sum measures across multilevel data. For example, you can roll up revenues, assets, or liabilities for companies and their subsidiaries. Or, you can roll salesperson data up the management chain to see aggregates by team, region, area, and beyond. Hierarchical Aggregation requires rows with an ID and a parent ID. Many rows can have the same parent ID, or the parent ID can be empty. Some rows can even share an ID, such as a record with multiple parents. You can also use the optional roll up percentage to apply percentage splits to allocate portions to different parents, such as commission among members of the sales team.
- In a batch data transform that already has at least one Input node, select the
Add Node button (
 ) between two nodes or at the end of the data transform.
To show the Add Node button between two nodes, hover the cursor on the connecting line.
) between two nodes or at the end of the data transform.
To show the Add Node button between two nodes, hover the cursor on the connecting line. - In the Add Node dialog box, select Aggregate.
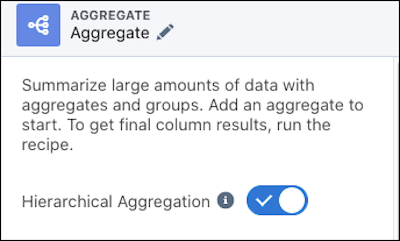
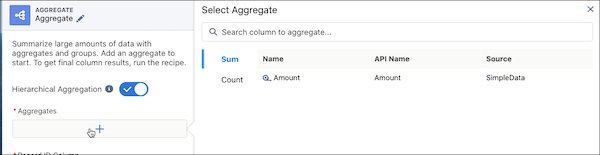
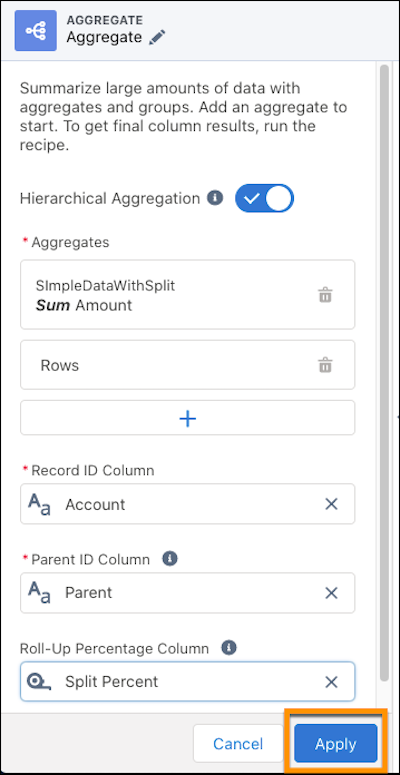
- In the Aggregate settings panel, turn on Hierarchical
Aggregation.
- Add at least one Aggregate, such as the sum of a measure or count of
rows.
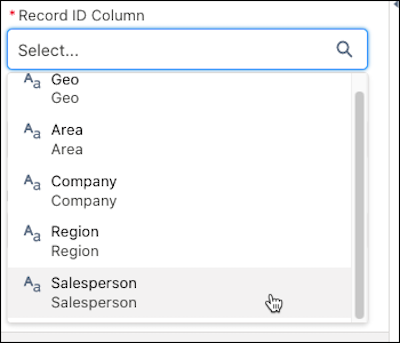
- Select the Record ID Column. The record ID can be any dimension in
the data that defines the row, such as salesperson or account name.
- Specify the Parent ID Column. The parent ID identifies which record each row rolls up to. This can be any dimension in the data that has not been selected as the record ID, such as the manager or parent account. Not every record needs to have a parent, for instance if it’s at the top of a hierarchy.
 Note Null values are accepted in the parent ID column.
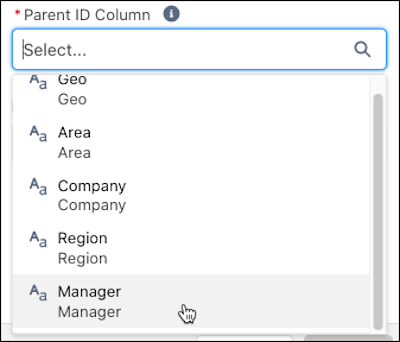
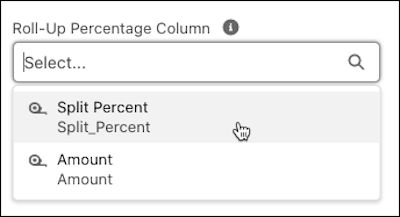
- Optionally, select a Roll-Up Percentage Column to apply a percentage
split. The aggregated value is multiplied by the number in this column. For example, your
records have more than one parent and want to roll them up differently based on the
parent.
- To add the Hierarchical Aggregation to the data transform, click
Apply.
- Save the batch data transform.Example 1: Automatically sum values at each level of the relationship instead of calculating values manually.Note In the following examples, Amount is the aggregated column.
This example shows:
- Multiple records with the same parent
- Mix of records with and without a parent
- A record outside of the hierarchy
- Parent with individual value
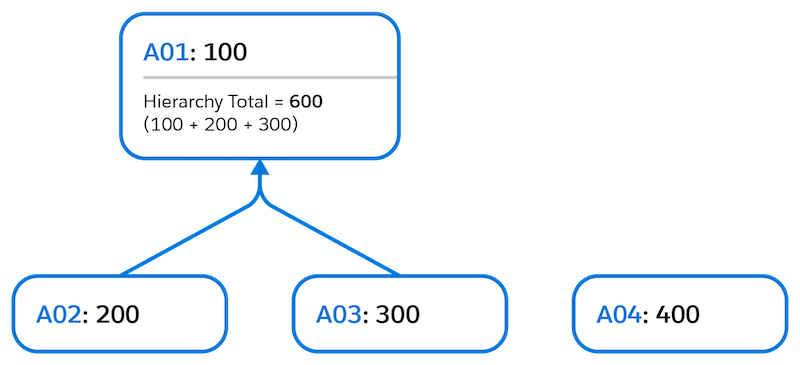
Without Hierarchical Aggregation With Hierarchical Aggregation Record ID Parent ID Amount Record ID Amount A01 100 A01 600 A02 A01 200 A02 200 A03 A01 300 A03 300 A04 400 A04 400 Example 2: Intermediate hierarchy: an org chart.This example shows:
- Multiple records with the same parent
- Mix of records with and without a parent
- A record outside of the hierarchy
- Parent with individual value
- Parent without individual value
- Multiple hierarchies
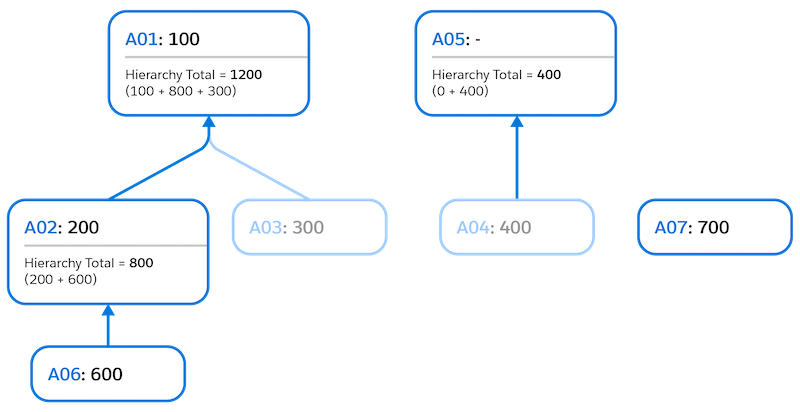
Without Hierarchical Aggregation With Hierarchical Aggregation Record ID Parent ID Amount Record ID Amount A01 100 A01 1200 A02 A01 200 A02 800 A03 A01 300 A03 300 A04 400 A04 400 A06 A05 600 A05 400 A07 A02 700 A06 600 A07 700 Example 3: Complex hierarchy: subsidiary ownership with split percentages.This example shows:
- Multiple records with the same parent
- Mix of records with and without a parent
- A record outside of the hierarchy
- Parent with individual value
- Parent without individual value
- Multiple hierarchies
- Records with multiple parents Note A record has a row per each parent.
- Roll-up percentage values (percentage splits)
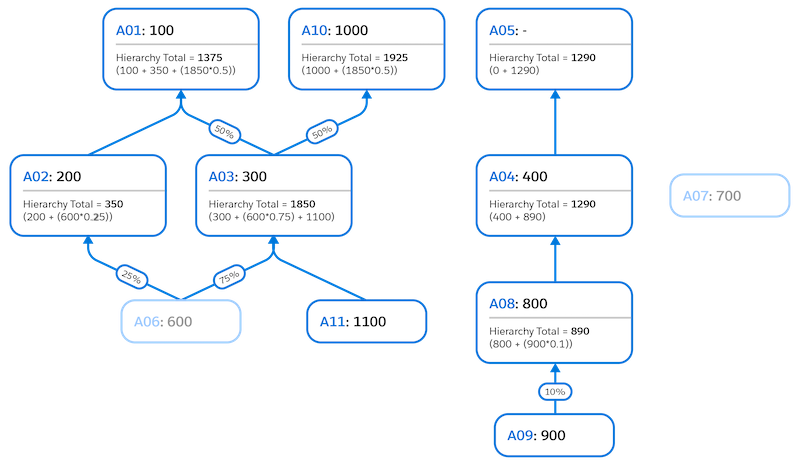
Without Hierarchical Aggregation With Hierarchical Aggregation Record ID Parent ID Amount Percentage Record ID Amount A01 100 A01 1375 A02 A01 200 1.00 A02 350 A03 A01 300 0.50 A03 1850 A03 A05 300 0.50 A04 1290 A04 A05 400 A05 1290 A06 A02 600 0.25 A06 600 A06 A03 700 0.75 A07 700 A07 A03 1.00 A08 890 A08 A04 1.00 A09 900 A09 A02 0.10 A10 1925 A10 A11 1100 A11 A03 1.00
Did this article solve your issue?
Let us know so we can improve!