You are here:
Create a Data Graph
Before creating a data graph in Data 360, decide which existing data model object (DMO) to use as the primary DMO. The primary DMO determines which related objects you can include in the data graph.
Required Editions
When creating a data graph, choose and enter the property values carefully. You can’t edit or update the data space, data graph API name, or primary DMO after you move beyond the first step in the builder. You can change the data graph name and description up until you save and create the data graph.
| Available in: All Editions supported by Data 360. See Data 360 edition availability. |
| User Permission Set Needed | |
|---|---|
| To create a data graph: | Permission set:
|
- From the App Launcher, search for and select Data Graphs.
-
Click New, and click Start from
Scratch.
- Choose a near real-time data graph or a real-time data graph.
- Select or enter a value for each property field.
- Click Next.
-
If you're creating a real-time data graph, set the consumption limits, and click
Next.
Consumption limits can impact cost and performance. See Record Caching and User Session Length in Real-Time Data Graphs.
-
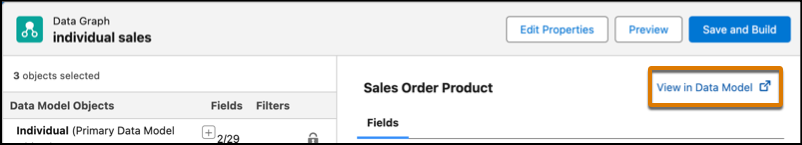
Select fields from the primary DMO to include in the data graph.
The primary key field, related key qualifier field, and applicable foreign key fields are selected by default and added to the data graph for the primary DMO and its related objects.
-
To add related objects, click + or search for a DMO, and select
fields for each related
object.
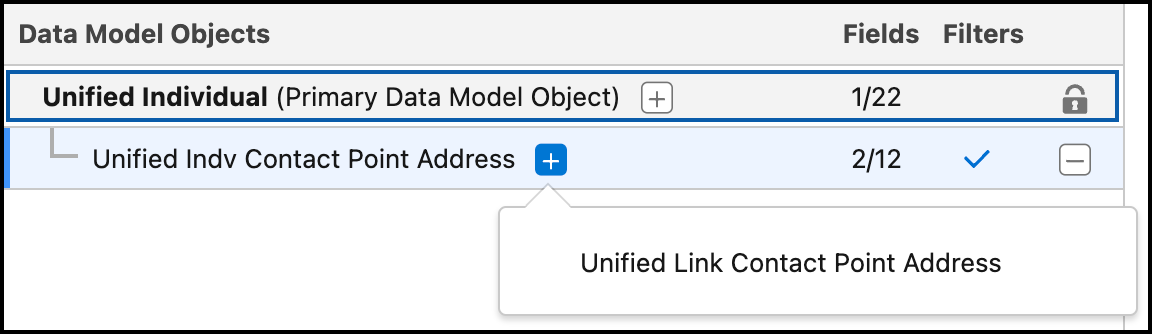
If a DMO has more than one path, choose a path from the list of results. Longer paths add more levels to your data graph.
To apply filter settings, go to the Filters tab. The available filter settings depend on the DMO category.
In real-time data graphs, the relationship join must use the primary key of the parent data model object (DMO). If a relationship requires a non–primary key field from the parent DMO, it isn’t supported for real-time data graph.
When you create a real-time data graph, you can’t add DMOs that create an N:1 relationship. If you select a DMO that results in an N:1 relationship, the system blocks the selection and displays an error message. Real-time data graphs support only 1:1 and 1:N relationships. This restriction applies to newly created real-time data graphs.
- To view the structure of the JSON blob, click Preview.
-
Save your work.
- To save the data graph without making it active, click Save Draft. The data graph is saved in draft status.
- To create the data graph, click Save and Build.
-
Select a refresh interval for the data graph.
- Every 30 Minutes
- Every 1 Hour
- Every 4 Hours
- Daily
- Weekly
- Monthly
- Streaming
Real-time data graphs update continuously and reflect the most current changes in DMOs for all real-time events. Whereas, standard data graphs adhere to a scheduled refresh.The default refresh interval is daily. Selecting a shorter refresh interval can raise costs. You can't select a refresh interval for draft data graphs.Streaming is validated at the Save and Build step. If unsupported features are present, you can’t proceed. Remove incompatible elements and try again. N:1 relation between DMOs and ad hoc filters are not supported with streaming data graphs.
The processing time to create an active data graph depends on the size of the primary DMO and related objects, anywhere between 15 minutes and several hours. You can check the processing status on the Data Graphs tab. If the status is Error, the data graph couldn’t be created. Contact your Salesforce account executive for help with resolving the error.
After the data graph is created, you can view, edit, clone, refresh, and delete it. You can also query the metadata and the JSON blob data using Data 360 Metadata API and Query API. Draft data graphs can't be cloned or refreshed.