
You are here:
Create a Streaming Insight Using Builder
Use near real-time data in Data 360 by creating a streaming insight. A streaming insight focuses on data at a specific time. You can write SQL expressions to compute streaming metrics across dimensions from your real-time data sources. Use a streaming insight to perform cross-functional orchestration and optimize your data in Data 360.
Required Editions
| Available in: All Editions supported by Data 360. See Data 360 edition availability. |
| User Permission Sets Needed | |
|---|---|
| To create streaming insights: | Permission set:
|
Setting up streaming insights requires several prerequisites and steps. To ensure the best results, follow this action flow.
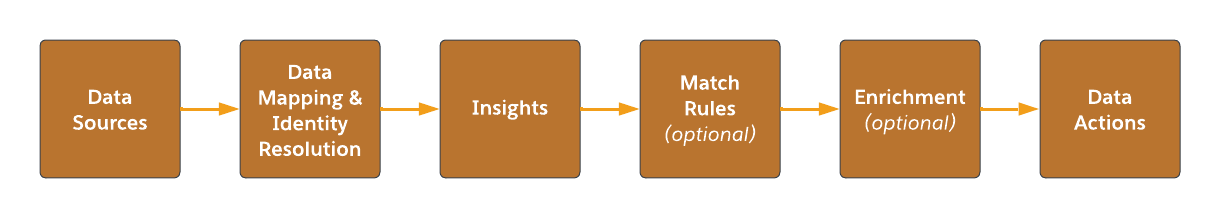
- Data sources—Map sources to different objects from Web & Mobile SDK and Marketing Cloud Personalization (formerly Interaction Studio) data streams.
- Identity resolution and data mapping—Ingest your data into Data 360, and create unified individuals with identity resolution.
- Insights—Streaming Insights are similar to calculated insights but have specialized functions to manage streaming data.
- Match rules—Enrich with unified individual data from customers.
- Enrichment—Enhance data actions with profile-related attributes.
- Data actions—Apply data actions on a streaming insight and evaluate if the action is necessary.
- In Data Cloud, go to the Calculated Insights tab, click New.
- From the Data Space dropdown, select a data space.You can use only the data spaces that you have access to.
- Click Streaming Insight.
- Click Use Visual Builder and click Next.
-
Select the object, and then click Next.
Only the objects that are created from streaming data sources such as Web SDK and Mobile SDK are available to create a streaming insight.
- If your Insight includes currency fields, select the Insight Currency value at the top of the page.
- Add the nodes by clicking + next to the object.You must select at least one aggregate node.
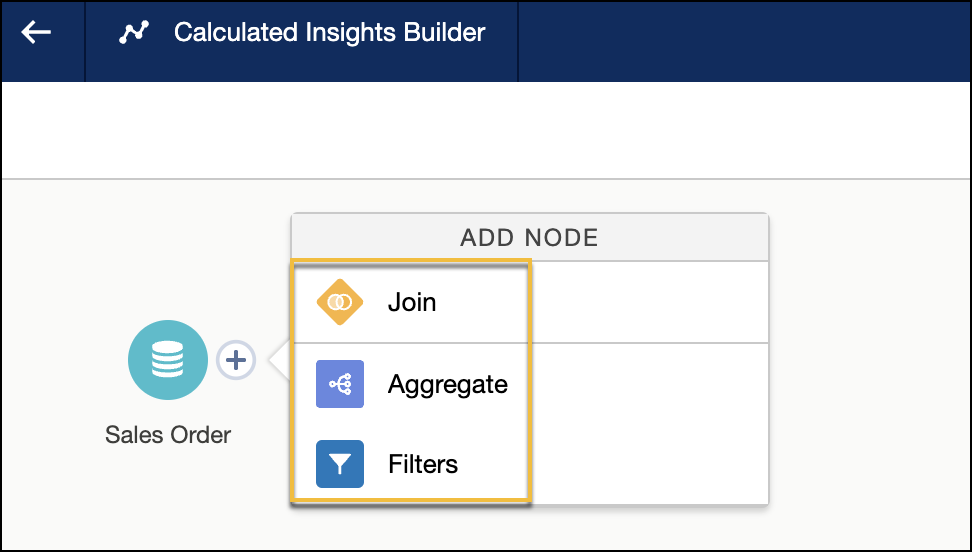
- Add measures and dimensions to your insight by clicking
Aggregate.You must select at least one measure.
- Enter a date and time window duration for your insight.
- From the Granularity dropdown, select a time interval.
- Under Measures, click +.
- Select a metric function and the field that you want to calculate, and then click Next.
- Enter the metric name, and click Apply.
- Under Dimensions, click +.
- Select the field that you want to group by, and click Next.
- Enter the dimension name, and click Apply.
- To save the aggregate node, click Apply.
- (Optional) To enhance your insight with additional data, add the join and filters nodes.
- Click Save and Run.
- Enter the streaming insight name, and click Next.The Streaming Insight API Name field is auto-filled.
- Click Save.
You can now view your streaming insight on the record home page. The last run status of a streaming insight is always Processing.
Example
SELECT COUNT( RealTimeMobileEvents__dlm.pageviews__c ) as page_views__c,
ssot__Individual__dlm.ssot__Id__c as customer_id__c,
RealTimeMobileEvents__dlm.product__c as product__c,
WINDOW.START as start__c,
WINDOW.END as end__c
FROM
RealTimeMobileEvents__dlm
JOIN
 ssot__Individual__dlm
ON
ssot__Individual__dlm.ssot__Id__c = RealTimeMobileEvents__dlm.deviceId__c
GROUP BY
window( RealTimeMobileEvents__dlm.dateTime__c ,'5 MINUTE'),customer_id__c, product__c
| start_c | end_c | customer_id_c | product_c | page_views_c |
|---|---|---|---|---|
| 2023-01-01 12.00 AM | 2023-01-01 12.05 AM | 1 | HK0012 | 1 |
| 2023-01-01 12.05 AM | 2023-01-01 12.10 AM | 2 | JK0078 | 2 |
| 2023-01-01 12.10 AM | 2023-01-01 12.15 AM | 3 | HK0078 | 1 |
After you create a streaming insight, validate it in Data Explorer.
Did this article solve your issue?
Let us know so we can improve!