Experience Pulse displays metrics at the top of Workspaces. Click a metric to open the
corresponding report or dashboard for more information or to take action. Customize the displayed
metrics or create ones to meet your needs.
Required Editions
Available in: Enterprise, Professional, Unlimited, and
Developer editions.
To get started, map reports and dashboards to your Experience Workspaces. You can either map
manually or install the Winter ’18 or later version of the AppExchange package. After
installation, Experience Pulse displays automatically. If you have an Experience Cloud site with
Chatter, four tiles display after you install the package: Members, New Members, Unanswered
Questions, and Flagged Discussions.
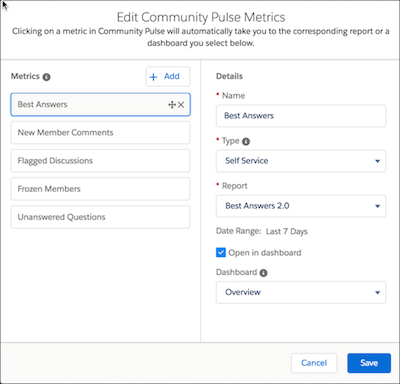
To customize a metric tile, click Edit Metrics. From here, create a
metric or edit an existing one. You can have up to six metrics at a time.
By design, clicking a metric opens the corresponding report. However, selecting Open
in dashboard lets you open a dashboard instead.
We use three kinds of cookies on our websites: required, functional, and advertising. You can choose whether functional and advertising cookies apply. Click on the different cookie categories to find out more about each category and to change the default settings.
Privacy Statement
Required Cookies
Always Active
Required cookies are necessary for basic website functionality. Some examples include: session cookies needed to transmit the website, authentication cookies, and security cookies.
Functional Cookies
Functional cookies enhance functions, performance, and services on the website. Some examples include: cookies used to analyze site traffic, cookies used for market research, and cookies used to display advertising that is not directed to a particular individual.
Advertising Cookies
Advertising cookies track activity across websites in order to understand a viewer’s interests, and direct them specific marketing. Some examples include: cookies used for remarketing, or interest-based advertising.