
You are here:
Report Chart
Use the Report Chart component to add reports to your site pages. Display the reports that you set up in your Salesforce org’s public folder.
When you click a report, you see the Report Detail page, which shows the Report Summary component. The report summary includes details from the source report in Salesforce.
Note In Report Chart properties, only the reports that have a chart appear on the
dropdown list.
- Drag the Report Chart component to the page, and select it.
-
In the property editor, configure the properties
for the component.
Property Details Report Name Reports with charts that are available for use in the site. Filter By Setting a filter on the report chart data is supported only for record pages. If you set a filter option, the Report Chart component displays only that filtered data to users. Refresh Time (Minutes) The number of minutes between each report refresh. Show report name Adds the report name to the site page. Show refresh button Shows a refresh button, so users can refresh the chart.  Warning Before Spring '25, Instead of a report’s developer name, the Report Chart component uses the ID of an associated report to populate the component. If a site page is deployed to another environment (such as from Sandbox to Production), the component breaks if the target org doesn't contain a report with the same ID. If the target org contains a different report that uses the same ID as the source org, the component references the wrong report.
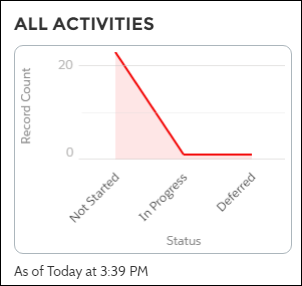
Example Report Chart component:

Note Starting Spring '25, the developer name is supported for
Report Charts. However, the Report Chart component won't render on the site if it's in a
private folder (This can happen if you move the report chart to a private folder after
adding it to a site) or if it contains a duplicate developer name. In both cases, you can't
retrieve the Report Chart ID.
Did this article solve your issue?
Let us know so we can improve!