You are here:
CRM Analytics Dashboard
Use the CRM Analytics Dashboard component to add CRM Analytics to your site's pages.
- Select the CRM Analytics Dashboard component in the page you’re configuring.
-
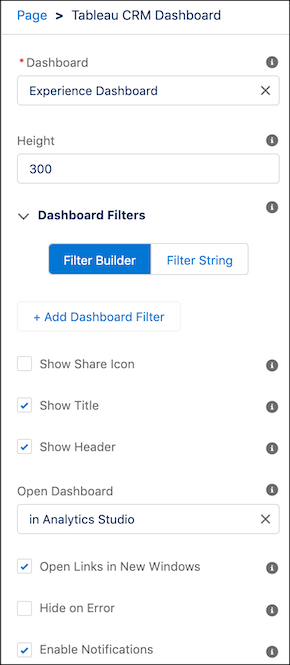
In the property editor, configure the properties for the component.
Property Details Dashboard Select an available dashboard from the dropdown list. Height Specify the height of the dashboard, in pixels. The default is 300. Filter Add selections or filters to apply to the dashboard when it appears on the page at runtime. You can filter dataset fields by variables or specified values. For filtering on dimensions, use this syntax:
{'datasets' : {'dataset1': [ {'fields': ['field1'], 'selection': ['$value1', '$value2']}, {'fields': ['field2'], 'filter': { 'operator': 'operator1', 'values': ['$value3', '$value4']}}]}}For filtering on measures, use this syntax:
{'datasets' : {'dataset1': [ {'fields': ['field1'], 'selection': ['$value1', '$value2']}, {'fields': ['field2'], 'filter': { 'operator': 'operator1', 'values': [[$value3]]}}]}}datasetstakes dataset system names which are found in the left panel of the edit page for a dataset. (If your org has namespaces, include the namespace prefix and two underscores before the dataset system name.)fieldstakes dimensions or measures in the dataset. To find the names, click the Explore icon to open the widget, select Show SAQL from the Options menu.valuescan be specific values or fields in a Salesforce object To find the name of a field, go to Setup, locate the object you want, and select Fields. Use the Field Name (also known as the API name). For custom fields, use the name with "__c" at the end.With the
selectionoption, the dashboard is shown with all its data, and the specified dimension values are highlighted. The selection option can be used alone or with the filter option. Selection takes dimension values only. To use this option, the dashboard must include a list, date, or toggle widget that groups by the specified dimension.With the
filteroption, the dashboard is shown with only filtered data. The filter option can be used alone or with the selection option. Filter takes dimension or measure values.Use
operatorwith the filter option. Supported operators for dimensions: in; not in; matches Supported operators for measures: = ; >= ; > ; <= ; <.Show Sharing Icon Add the Share icon on the dashboard. When this option is selected, users can click the icon to open the Share dialog, where they can post to Chatter and download images and data. To show the Share icon, the minimum dashboard height is 612 pixels. Default is false. Show Title Control the visibility of the dashboard title. When this option is selected, the dashboard’s title appears above the dashboard. Default is true. Show Header Control the visibility of the dashboard header. When this option is selected, the dashboard is displayed with a header bar that includes the Open in Analytics icon, the date and time that the dashboard’s data was updated, and the dashboard views menu. Note that the header bar also appears if either Show Sharing Icon or Show Title is selected. Open Links in New Windows Specify where links from the dashboard to other assets are opened. When this option is selected, links open in new windows. When this option isn’t selected, links open in the same window. Default is true. Hide On Error Control whether or not users see a dashboard that has an error. When this option is selected, if the dashboard has an error, it won’t appear on the page. When this option isn’t selected, the dashboard appears but doesn’t show any data. An error can occur when a user doesn't have access to the dashboard or it has been deleted. Default is false.