
You are here:
Forecasts
Use Forecast nodes to predict patterns for specific time periods in the future. A forecast node analyzes the past data points and their corresponding dates from the source data that you define in the Data Processing Engine definition. The forecast node then makes predictions about future values based on the historical data. For example, estimate the order quantity for the next four quarters based on the orders placed in the last five years. The Forecast node isn't available for definitions where the runtime is Data Cloud.
Required Editions
| View supported editions. |
Here’s the workflow for generating forecasts using Data Processing Engine.
- Create a Data Processing Engine definition.
- To define the historical data to be used for generating the forecast, create source nodes in the definition.
- To use the historical data to make predictions and configure forecast settings, add a forecast node to the definition.
- To write the forecast results of the definition, create a writeback object node.
Forecast Node Configuration Fields
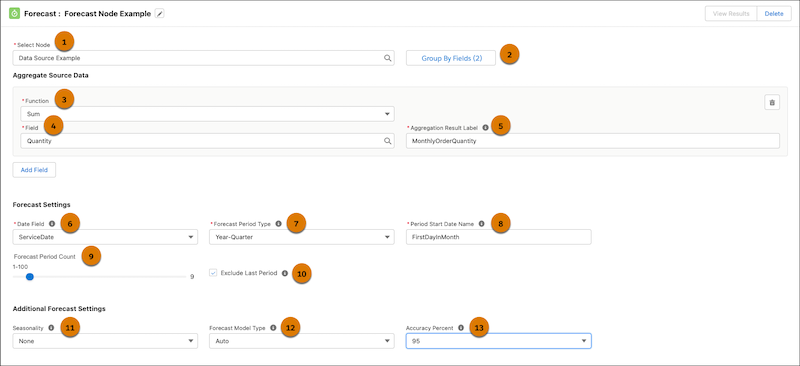
- Select source data for generating a forecast.
Field Description Source Node (1) Select the source node that contains the historical data that is used for generating forecasts. Group By Fields (2) Select fields from the source node to group rows in the source data. For example, group by region.
If a selected field is of the Date or DateTime type, also select date- or time-based grouping for the field.
- Aggregate the source data.
Field Description Function (3) Select a function to define the operation to be performed on the field selected for aggregation. The function determines how data from the selected field is combined into a single value. Field (4) Select the field that the aggregation function is to be applied to. Aggregation Result Label (5) Enter a name for the column that stores the result of the aggregate function (3) that’s applied to the selected field (4). For example, MonthlyOrderQuantity.
If necessary, add more fields to aggregate the source data.
- Configure forecast settings.
Field Description Date Field (6) Select a date field from the source node to group the data. This field is used to establish a time series or a chronological sequence of events used to predict future values. Forecast Period Type (7) Select how you want the dates from the selected Date Field (6) to be grouped. For example, Year-Month. Period Start Date Name (8) Enter a name that represents the start date of the forecast period based on the selected date field (6) and forecast period type (7). Forecast Period Count (9) Specify the number of periods that you want to generate the forecast for. For example, if you’ve selected Year-Month as the forecast period type (7), selecting 9 here generates a forecast for the next 9 months. Exclude last period (10) Select this option if the last period in your source has incomplete or partial data. For example, exclude the last time period when forecasting by month while data for the current month is still being collected so that it doesn’t influence your forecast. Seasonality (11) Select an option if periodic fluctuations happen around the same time every year. For example, if sales fluctuate quarterly, select 4 if you’ve selected Year-Quarter as the forecast period type (7). Forecast Model Type (12) Select a forecasting model.
- Additive uses Holt-Winters Additive method. Use this method when seasonal variations are largely constant throughout the series.
- Multiplicative uses Holt-Winters Multiplicative method. Use this method when seasonal variations change proportionally to the average (level of the series).
- Auto selects the most accurate forecast method.
Accuracy Percent (13) Select an accuracy percentage to account for errors in the forecast. Accuracy percent indicates your level of uncertainty or variation in the forecast results. Based on your selection, a range of values is generated for the forecast result.
For example, you aggregate the source data by total orders and label the aggregation result as TotalOrders. Then, you select 95 as the forecast accuracy percentage. The forecast result generates these columns: TotalOrders_forecast, TotalOrders (Low 95), and TotalOrders (High 95). Here, TotalOrders_forecast provides the mean values from the range, TotalOrders (Low 95) represents the lowest range values, and TotalOrders (High 95) represents the highest range values.