
You are here:
Use the Client Interactions Dashboard (Managed Package)
Financial advisors: Make sure you’re taking the actions that retain clients by getting instant insight into the results of your client management activities. Learn how you’re spending time, see who’s overdue for attention, and understand which activities have the most positive results. Use the dashboard’s KPIs to identify clients who need immediate action from you to keep them loyal and satisfied.
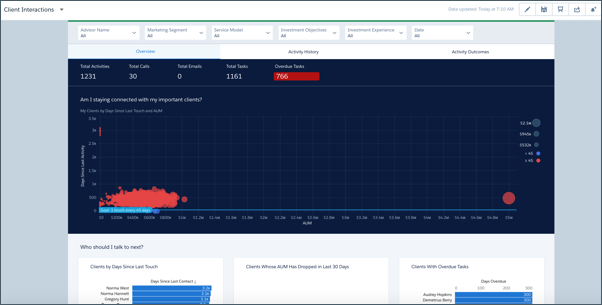
Overview Page
Shows clients that have been neglected and their importance according to AUM or other metrics. Also shows days since last contact with clients, clients whose AUM has dropped, and clients with overdue tasks. Click a bubble representing a client in the top chart to learn if they’re due immediate attention and for details to use when you contact them.
Activity History Page
Shows how an advisor has spent time according to activity type and time period. Chart on the left shows tasks according to type, chart on the right total tasks by date. Select W to view activities by week, M to view by month, and Q to view by quarter. Click a bar to view details about the task type or period in the following table.
Activity Outcomes Page
Learn the results of your activities. Click a bar for a time frame to see clients that you met that period. Then view the impact of your activities on those clients’ AUM, wallet share, assets under advisement, and deposits. Select W to view outcomes by week, M to view by month, and Q to view by quarter. The following charts compare outcomes to the average for all clients. Change toggle to Top 20 to compare outcomes to average for your top clients.