
You are here:
Use the Events and Seminars Dashboard (Managed Package)
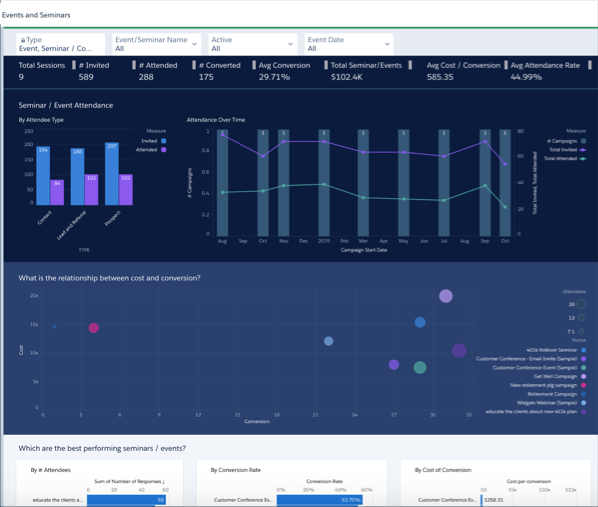
Understand the impact of events and seminars on your business. Metrics across the top show top-level numbers for your events, including average conversion rate and cost per conversion for event attendees and average attendance rate.
Change filter selections at the top to view a segment of event attendees.
Click an Attendee Type bar in Seminar/Event Attendance to see the attendance over time for that type in the chart on the right. Then scroll down to the details tables at the bottom to see details for the events and invitees for that type.
Chart in the middle shows the relationship between the cost of an event and conversion rate of attendees for the types of events you hold. Select a bubble for the event type to see the impact of cost for that type of event on conversion. The details tables at the bottom then show details for only that event type.
The following charts that show your best performing events according to the number of attendees, conversion rate, and cost of conversion. Click a bar for an event type in any of the three charts and the other two charts also show only results for that type. Details tables at the bottom also show events and attendees for only the selected type.