
You are here:
Get Actionable Insights from Your Data with Analytics for Manufacturing
Analytics for Manufacturing dashboards visualize all aspects of your business to help you stay on top of sales agreements, orders, and contracts.
The CRM Analytics for Manufacturing app includes two types of dashboards:
- Dashboards accessed through the app in Analytics Studio.
- Embedded dashboards that deliver insights from within the context of Salesforce objects you work with.
They’re designed to answer key questions about your business.
In-App Dashboards
Open CRM Analytics for Manufacturing to see dashboards accessed through Analytics Studio.
- From App Launcher, select Analytics Studio to open the Analytics home page.
- Under Browse in the left column, select All Items.
- Select the Apps tab, then click your app. If you can’t immediately find it, consult your Salesforce administrator to find out the name they gave it when creating the app.
Now that your app is open, click the Dashboards tab to see a list of all the app’s dashboards. Find the Key Account Manager Home dashboard, and open it. The home dashboard gives account managers at-a-glance insight into top-level metrics. Begin your analysis of manufacturing cloud data in the context of broader business goals. Learn the health of your accounts, products’ performance, product pricing, forecast accuracy, agreement compliance rates, and other key performance indicators (KPIs) that impact your business.
Accounts Health
Helps you improve the health of your accounts. The charts on the Overview page show how revenue is doing against plan and forecasts for all your accounts, and how revenue is trending over time. Other pages answer key questions about your accounts.
-
Overview
- How’s my business doing against the plan?
- How’s my business doing against the forecast?
-
Accounts in Focus
- Which accounts can increase incoming orders?
- Which accounts are performing well and which accounts are at risk of churn?
-
Relationship With my Accounts
- What’s the current and planned length of relationship of my accounts?
- What’s the customer lifetime value of my accounts?
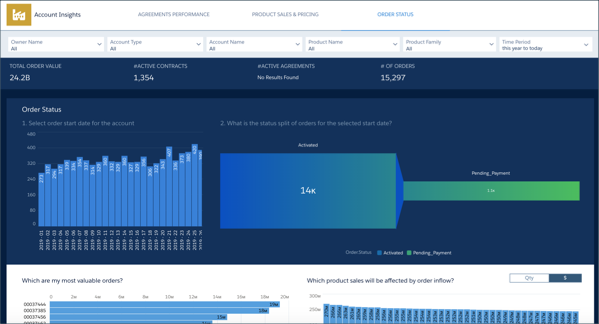
Account Insights
View KPIs about each of your accounts. Open the Account Name menu, and select an account. Then get answers to the following questions about that account from the dashboard’s three pages.
-
Agreements Performance
- How has the account’s revenue grown over time and will it achieve its goal?
- How is planned revenue trending for the account?
- How is the account performing against its commitments?
- What is the missed revenue over time for the account?
-
Product Sales & Pricing
- Which products have sold the most to this account and at what price?
- How is the account performing against product demand goals?
-
Order Status
- What is the status of orders for the account?
- Which orders need attention?
-
Sales Forecast
- How's my account performing against the forecast?
- What’s in the forecast?
Statistical Order Forecasting
Work on an effective manufacturing plan by analyzing statistical order forecasts for an advanced account forecast set. The statistical forecast data includes order quantity and order revenue values. Plan better at a granular level by selecting an account, the order’s status, and a product.
- What’s the trend of forecasted order quantity and revenue over the course of the specified time period?
- What’s the distribution of forecasted order quantity and revenue for a specific product based on the order’s status?
- What’s the accuracy of the forecasted order quantity and revenue values?
Product Performance
Track your top-selling products and get insights into supply and demand across your product line through the dashboard’s two pages.
-
Sales Trend
- What are my top-selling products and product families?
- Which products are trending up or down for my accounts?
- Which accounts contribute most to a product’s sales?
- How has the product mix changed over time for my accounts?
-
Actual vs. Planned
- What are the demand realization levels of the products?
- Which account is contributing most to the demand shortfall of a product?
-
Actual vs. Forecast
- How are products performing against forecasted demand?
Product Demand
Helps you optimize your inventory based on the planned and forecasted demand of products.
-
Planned Demand
- What's the planned demand for my products?
- Which are my top performing accounts and agreements based on planned revenue?
- Which accounts and agreements contribute most to the planned demand of a product?
-
Forecasted Demand
- What’s the forecasted demand for my products?
- Which are my top performing accounts and agreements based on forecasted revenue?
- Which accounts contribute most to the forecasted demand of a product?
Forecast Analysis
Analyze changes in forecasts, and improve accuracy and demand planning.
- How accurate are my forecasts?
- What’s the trend of the forecast accuracy?
- What’s the change in the forecast?
Pricing Insights
The dashboard’s two main charts answer key questions to help you determine optimal product pricing.
-
Price Trend
- What is the price trend for a product across all accounts?
- What is the product priced for my account vs all accounts?
-
Price Elasticity
- What is the price elasticity for a product across all accounts?
Sales Agreements
Get instant insight into the state of all your sales agreements, and identify agreements that need immediate action through the dashboard’s two pages.
-
Performance
- What are the realization and compliance levels of all my agreements?
- What are my best and worst performing agreements?
- When have I experienced the highest demand shortfall this year?
-
Pipeline
- What does my sales agreement pipeline look like?
- Which agreements need my attention?
- How have cancellations impacted revenue loss?
My Targets
Track your performance against revenue targets, and identify accounts and products that need attention.
- How am I performing against revenue targets?
- Which accounts need my attention?
Team Targets
Monitor your team’s performance against revenue targets, and assign targets to team members based on historical trends and forecasts.
- How’s my team performing against revenue targets?
- Who are the top performers in my team?
- Who needs attention?
Whitespace Analysis
The dashboard’s two pages help you uncover opportunities to grow your business by selling new agreements and cross-selling to existing accounts.
-
Accounts Whitespace
- Which accounts do not have active agreements?
- What are the cross-sell opportunities for those accounts?
-
Product Recommendations
- What product combinations work best?
- How can I expect the number of products sold to increase through cross-sell opportunities?
Distributor Performance
Identify your top-performing distributors and get insights into supply and demand across your product line through the Distributor Performance dashboard.
-
Sales Trend
- What are my top-selling products and product families?
- Which products are trending up or down for my distributors?
- Which distributors contribute most to a product’s sales?
- How has the product mix changed over time for my distributors?
-
Actual vs. Planned
- What are the demand realization levels of the products?
- Which distributors contribute most to the demand shortfall of a product?
-
Actual vs. Forecast
- How are products performing against forecasted demand?
Embedded Dashboards
CRM Analytics for Manufacturing includes dashboards that can be embedded in Lightning Experience pages. They provide detailed insights into product performance, sales agreements, and other aspects of your business. Your Salesforce admin embeds these dashboards in specific Salesforce pages, as described here. After that, go to the specific pages to view the dashboards.
Dashboards Embedded in a Sales Agreement Page
These dashboards can be viewed from Sales Agreement pages in the Manufacturing Cloud.
-
Sales Agreement Product Performance
- How is the agreement performing?
- How are the products offered in the agreement performing against their planned numbers?
- What are the best prices for the products offered in the agreement?
-
Sales Agreement Revenue Realization
- What’s the probability that the agreement is renewed?
- What are the most important factors contributing to renewal?
Dashboards Embedded in other Manufacturing Cloud Pages
These dashboards can be viewed from the Manufacturing Cloud Home page, or any other page your admin embeds them in.
-
Manufacturing Product Performance
- What are my best and worst performing products?
-
Manufacturing Home Page
- What is my current revenue and revenue projection?
- Which of my accounts need attention?
- What accounts can help me get more business?
-
Manufacturing Agreement Performance
- What are my best and worst performing agreements?
- What agreements are pending approval or need renewal?
-
Target Attainment
- What’s my target attainment?
- What’s the projected attainment?
-
Team Performance
- How are my team members performing against revenue targets?
- How did my team perform last year?
- Analytics for Manufacturing Auto-Embedded Dashboards
The Analytics for Manufacturing app includes dashboards that are auto-embedded in the Lightning Experience pages. - Pre-Configured Einstein Discovery Stories
The pre-configured Einstein Discovery stories give you intelligent insights that help you maximize the sales agreement product renewals and offer better pricing for products and schedules. - Calculate Key Performance Indicators Using CRM Analytics
Learn the definitions of key metrics shown in Manufacturing Analytics dashboards.