
Audit Dashboard
Analyze your carbon emissions, verify the accuracy of the emissions data, and ensure that the measures taken by your organization are effective.
Required Editions
| Available in: Enterprise, Professional, Unlimited, and Developer Editions where Net Zero Cloud is enabled |
The Audit dashboard, available in the Net Zero Analytics app template, includes Overview, Emission Factors, Data Quality, and Renewable Energy pages. Filter the charts on the dashboard based on business region, account name, asset, asset type, reporting year, and emission factor update year.
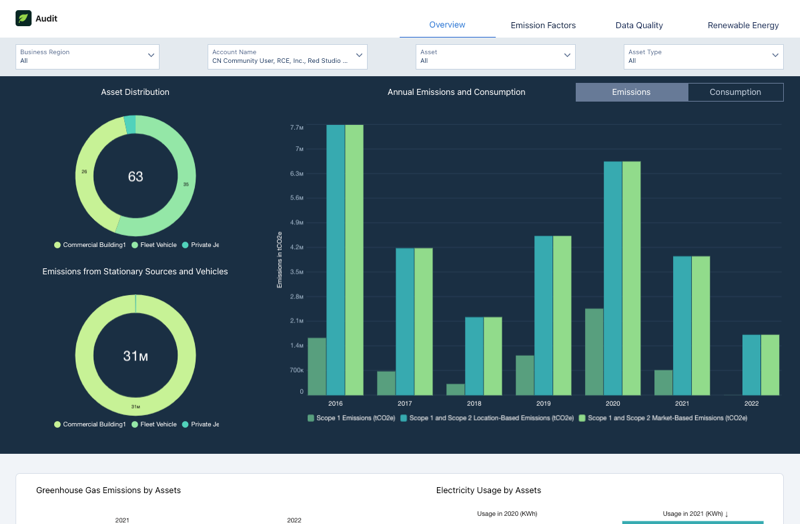
- Overview page: Use the Overview page to analyze the count of emissions sources by asset type and total greenhouse gas emissions from stationary sources and vehicles. View the total energy consumption by stationary sources and total fuel consumption by vehicles. You can also compare electricity consumption between the reporting year and the comparison year.
- Emission Factors page: Use the Emission Factors page to view the applied emissions factors for a specific business region.
- Data Quality page: Use the Data Quality page to analyze the average energy consumption intensity for the specific business region and the monthly energy consumption patterns. View the variance in electricity usage over time and the overall electricity and energy consumed by assets throughout the reporting year.
- Renewable Energy page: Use the Renewable Energy page to analyze renewable energy usage and trends, and view total renewable energy consumption for the reporting year. You can track the allocated renewable energy and the overall renewable energy trends and compare renewable energy consumption with total energy consumption to understand the proportion of energy from renewable sources.
Note You can access the Audit dashboard from the Net Zero Cloud app's landing page.
- Key Performance Indicators
Learn the definitions and calculations of key metrics shown in the Audit dashboard.
Did this article solve your issue?
Let us know so we can improve!