
Climate Action Dashboard
Get insights into your organization's carbon emissions data that you can use to devise a climate action plan to reduce your emissions.
Required Editions
| Available in: Enterprise, Professional, Unlimited, and Developer Editions where Net Zero Cloud is enabled |
The Climate Action dashboard, available in the Net Zero Analytics app template, consists of the Overview, Carbon Emission Forecast, and Renewable Energy pages. Filter the charts on the dashboard based on business region, account name, asset, asset type, and a specific duration. View the charts based on records associated or not associated with the Annual Emissions Inventory (AEI).
You can also specify if you want to include Hydroelectricity as an energy type while populating the charts.
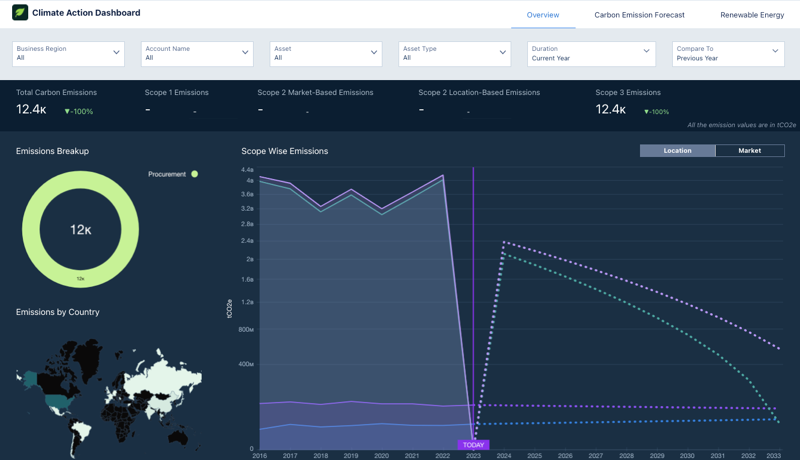
- Overview page: Use the Overview page to track emissions trends by scope 1, scope 2 location-based, scope 2 market-based, scope 3, and total emissions. Compare current emissions data with historical records and forecasted values using the interactive line charts. With CRMA's time series feature, visualize changes in emissions scope for the next 10 years based on historical data. Use the table view to assess carbon footprints from each energy use record, including AEI mapping status (AEI Mapping analyzes an organization's assets, environment, and infrastructure to understand its carbon footprint.) and total emissions. Visualize the emissions distribution by source and country, and identify the top contributors to your organization's overall emissions.
- Carbon Emission Forecast page: Use the Carbon Emission Forecast page to monitor overall emission trends by comparing forecasted and target emissions for both base and target years. Analyze emissions forecasts by scope, account, and emission type, and examine forecasted and target emissions by activity. Get future emission trend predictions and visualize emissions data over time using CRMA's time series feature and forecast data from the Net Zero Cloud Emission Forecast.
- Renewable Energy page: Use the Renewable Energy page to view the total energy and electricity consumed by your organization's buildings by energy type and city. You can select and compare the emissions from electricity consumption with renewable energy or allocated renewable energy emissions based on your requirement.
Note You can access the Climate Action dashboard from the Net Zero Cloud app's landing
page.
- Key Performance Indicators
Learn the definitions and calculations of key metrics shown in the Climate Action dashboard.
Did this article solve your issue?
Let us know so we can improve!