
Program Analysis Dashboard
Get a comprehensive view of multiple sustainability programs in an organization and their collective impact.
Required Editions
| Available in: Enterprise, Professional, Unlimited, and Developer Editions where Net Zero Cloud is enabled |
The Program Analysis dashboard is available in the Net Zero Analytics app template. Use the dashboard to analyze programs using various metrics such as annual emissions savings, annual program cost, marginal abatement cost, total abatement potential, and program NPV (Net Present Value). By default, the dashboard displays analytics based on the default indicator definition. To view and analyze the impact of other indicator definitions, you can use the View Other Indicator Definitions link.
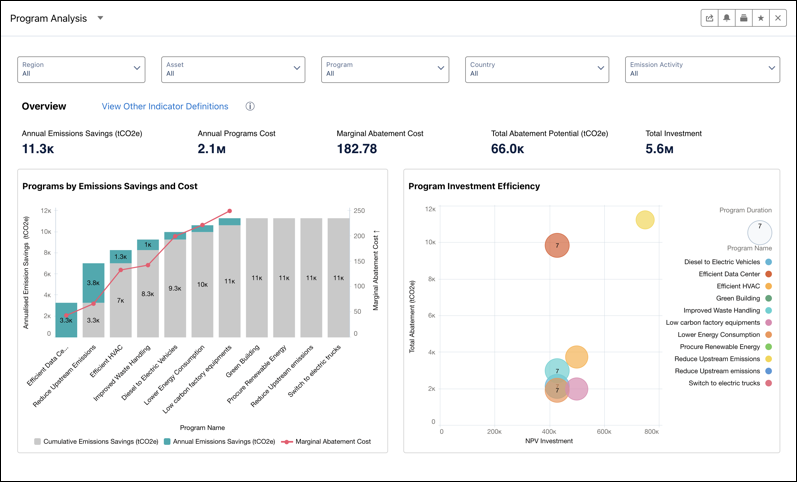
Accessible from the Programs Analysis tab in the Net Zero Cloud app, the dashboard includes these analytics charts:
- Programs by Emissions Savings and Cost: Analyze the programs by the annual emission savings, marginal abatement costs, and cumulative emission savings. Use the insights to identify highly effective programs based on emission reduction and cost efficiency.
- Program Investment Efficiency: Analyze the programs based on the total abatement cost and program NPV (Net Present Value). Use the insights to allocate resources more effectively by prioritizing programs with higher NPV and plan improvements for programs having higher costs without proportional benefits.
- Emissions and Forecast by Programs: View the total emissions, emissions forecast, and target emissions across different years for the selected programs. Use the insights to enhance decision-making by using historical emission data and forecasts to develop and optimize targeted strategies for emission reduction initiatives.
Filter the charts based on region, asset, program, country, and emission activity.