You are here:
Use License, Permit, and Inspections Analytics in Public Sector
Gain insights that help you effectively manage agencies and departments and improve constituent satisfaction.
Required Editions
| View supported product editions. |
| User Permissions Needed | |
|---|---|
| To view the Analytics for Licenses, Permits, and Inspections app in Analytics Studio: | CRM Analytics Plus Admin AND TCRM for Public Sector Admin OR CRM Analytics Plus User AND TCRM for Public Sector User |
To access the Analytics for Licenses, Permits, and Inspections app and its dashboards:
- From the App Launcher, select Analytics Studio.
- On the Analytics home page, under Browse, select All Items.
- Select the Apps tab, then click your app. For example, select LPI. If you can’t find it, ask your Public Sector administrator for the name of the app, or ask them to deploy it.
- Click the Dashboards tab to see the list of dashboards.
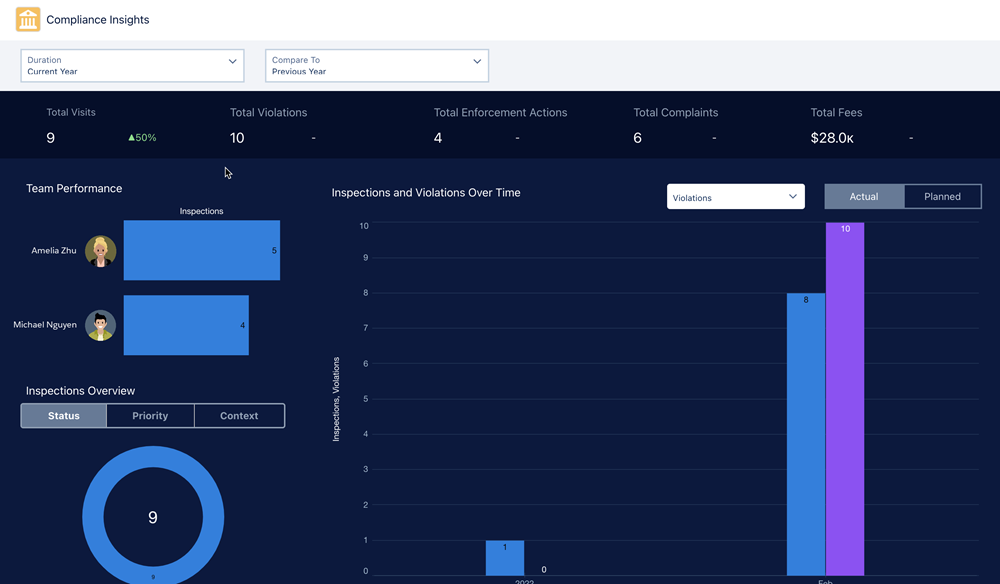
Compliance Insights
The Compliance Insights dashboard tracks your agency’s performance and provides insights into the impact of inspections and enforcement actions on violations. The dashboard charts answer these questions.
- How’s my team performing based on inspections?
- What’s the trend of inspections and violations over a selected time period?
- What’s the trend of inspections and enforcement actions over a selected time period?
- How’s my agency performing based on inspections, violations, complaints, and enforcement actions?
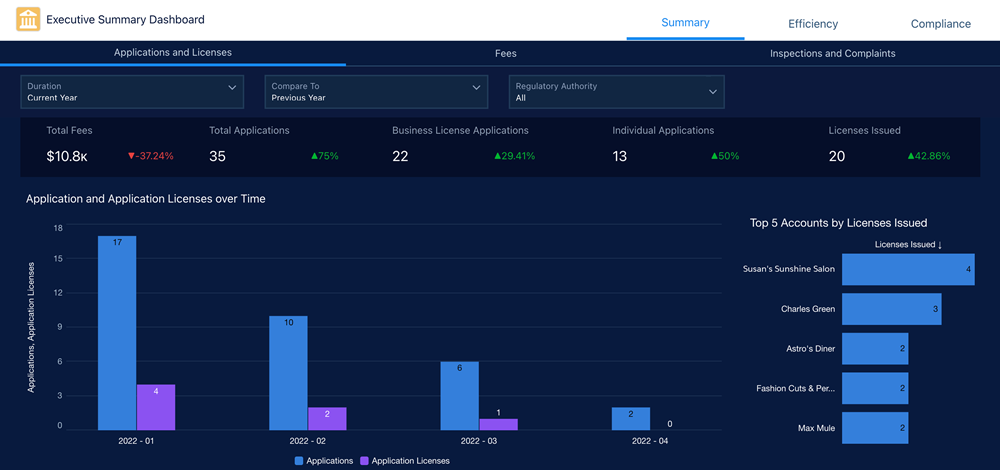
Executive Summary
The Executive Summary dashboard monitors your agency’s performance and constituent satisfaction. The dashboard charts answer these questions.
- What’s the trend of applications and application licenses over time?
- How are the applications distributed across business types, license types, and regulatory authorities?
- What are the top five accounts based on license issued?
- What’s the total fees charged over time based on fee sources?
- What’s the trend of inspections over time?
- What are the top five accounts based on total fees?
- How’s my agency performing based on inspections, violations, and complaints?
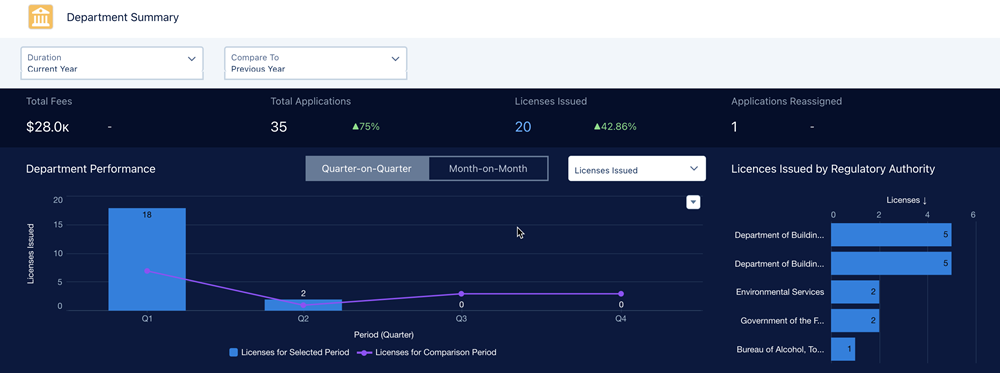
Department Summary
The Department Summary dashboard monitors your department’s performance and identifies applications and inspections that need attention. The dashboard charts answer these questions.
- How’s my department performing when compared to a previous period?
- What’s the total number of licenses issued by regulatory authorities?
- Which applications and inspections need my attention?
- What’s the distribution of inspections and violations by inspection type?
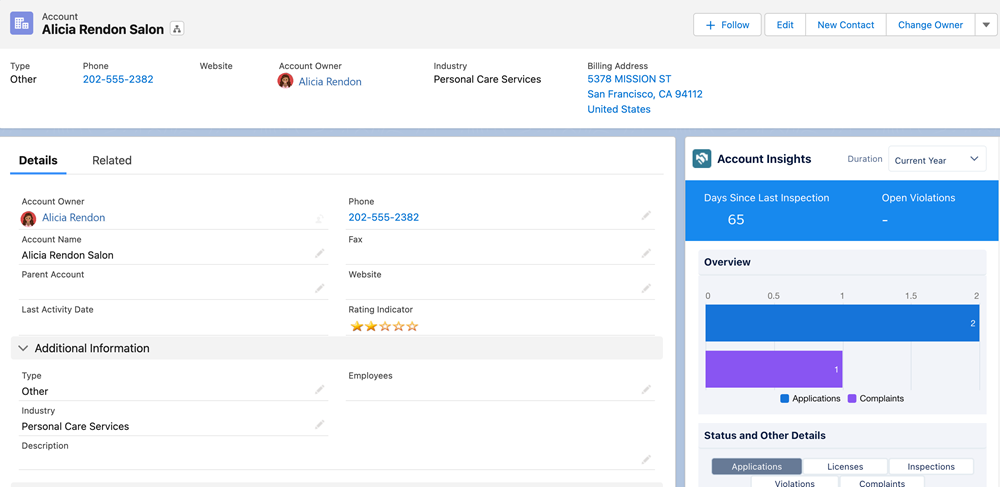
Account Insights
The Account Insights dashboard provides insights into the status of applications, licenses, complaints, inspections, and violations associated with the account. The dashboard charts answer these questions.
- How many open violations does this account have?
- What’s the duration for which the violations are open?
- What’s the status of applications, licenses, inspections, violations, and complaints?