Merchandiser Dashboards
Get actionable insights on store compliance, last store visit, inventory compliance, product performance, and account hierarchy. The dashboards give you easy access to retail execution KPIs that help you perform merchandiser activities effectively.
Required Editions
| Available in Enterprise, Performance, and Unlimited editions where Consumer Goods Cloud is enabled. |
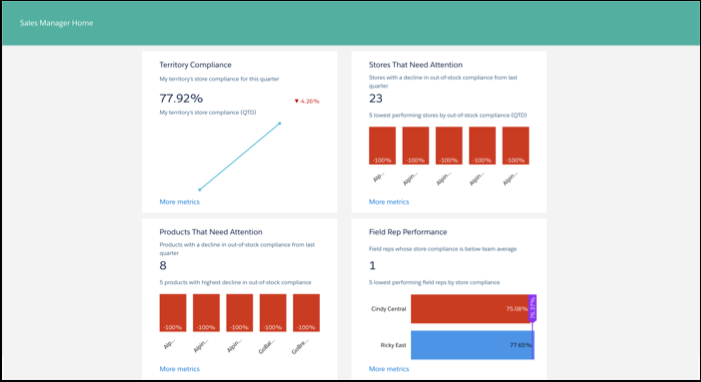
Sales Manager Home
The Sales Manager Home dashboard gives sales managers quick insight into top key metrics of retail execution. Get an overview of your field rep performance, territory’s compliance, stores that need attention, and products that need attention.
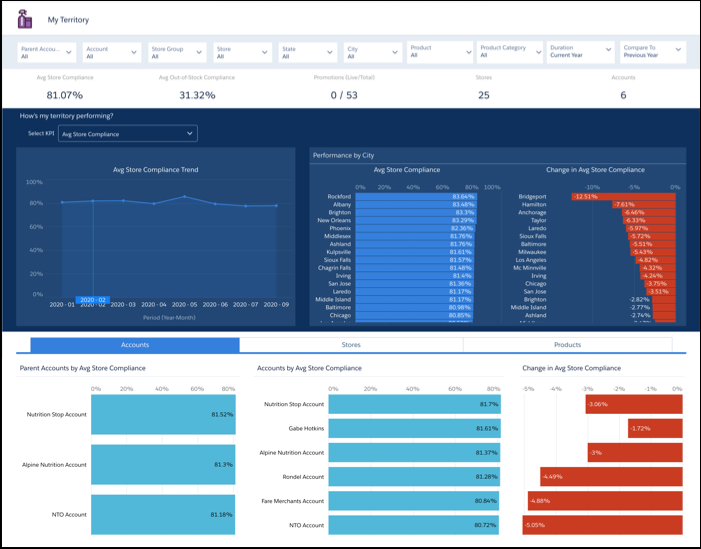
Territory Performance
The Territory Performance dashboard’s charts answer the following questions about your territory.
- How’s my territory performing based on the retail execution KPIs?
- What are the compliance trends in my territory?
- Which cities in my territory have a significant change in compliance?
- What are the top-performing accounts, products, or product categories?
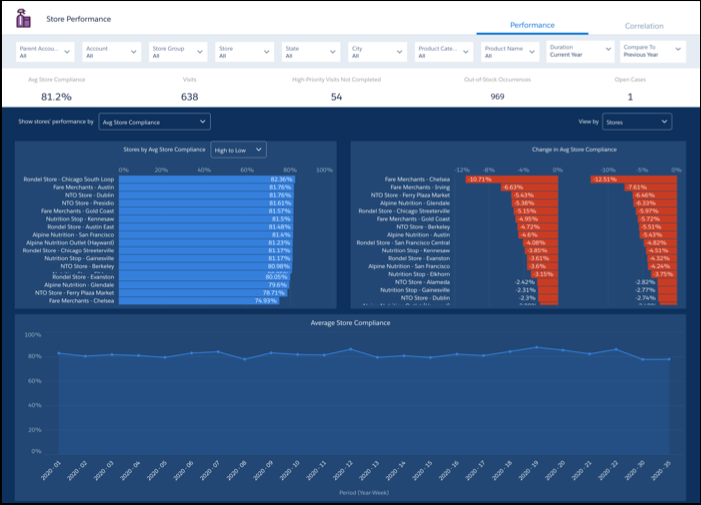
Store Performance
The Store Performance dashboard’s charts answer the following questions about your stores.
-
Performance
- How are my stores performing based on retail execution KPIs?
- Which of my stores need attention?
-
Correlation
- How are the retail execution KPIs affecting store performance?
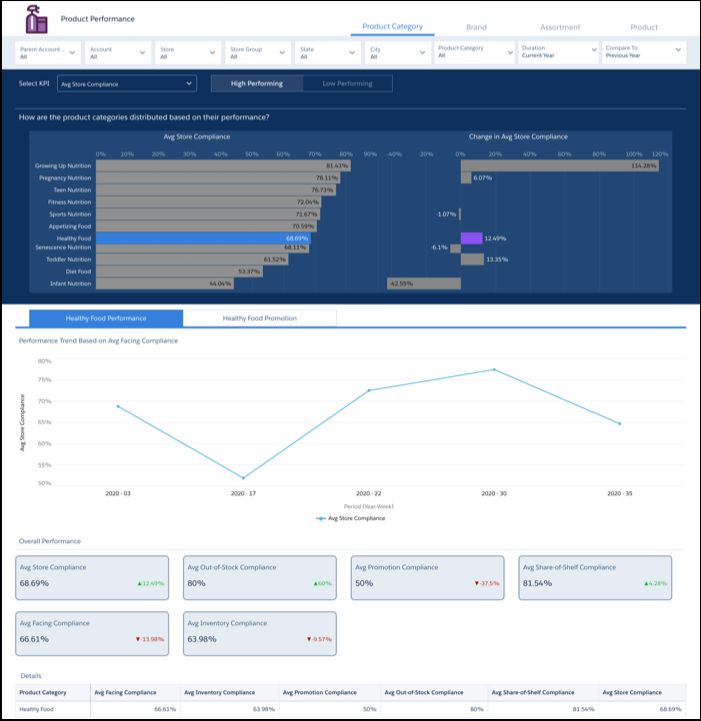
Product Performance
The Product Performance dashboard gives you actionable insights into products, product categories, brands, and assortments. You can also measure the effectiveness of a promotion across products or product categories. The dashboard charts answer the following questions.
- How are the products, categories, brands, and assortments performing?
- Which products or categories need my attention?
- What are the high-performing and low-performing products?
- How did the newly launched products perform during the last 180 days?
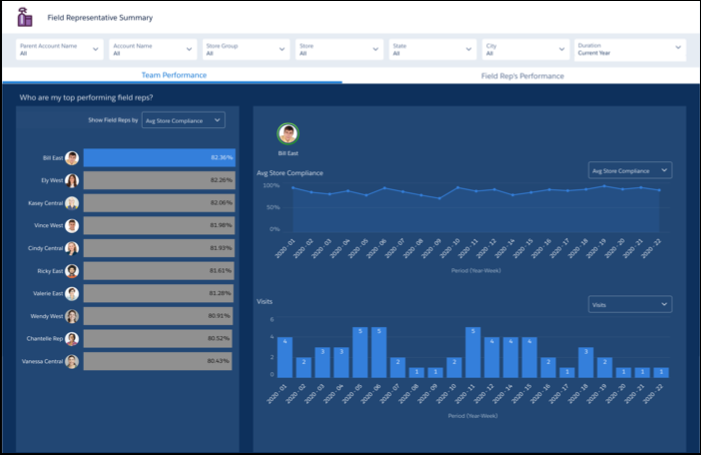
Field Rep Performance
The Field Rep Performance dashboard helps you identify field reps who need attention and improve their performance. The dashboard opens to the Team Performance page with charts that show a leaderboard of the field reps and how they perform over time. Determine best practices for top performing reps based on correlation between two KPIs.
- Team Performance
- Who are my top-performing reps?
- Who needs attention?
- Field Rep’s Performance
- How’s the field rep performing compared to the team’s average?
- What are the strengths and areas of improvement?
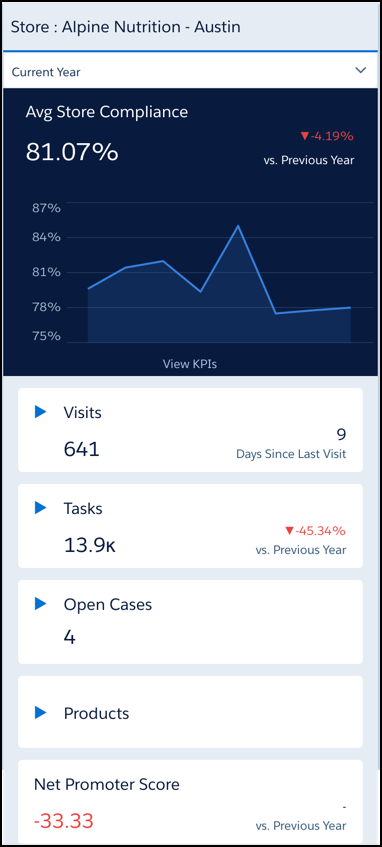
Store Insights
The dashboard’s charts answer the following questions about your stores.
- How are the store's visits, compliance, and retail execution KPIs trending?
- How many support cases are still open?
- What’s the store’s net promoter score?
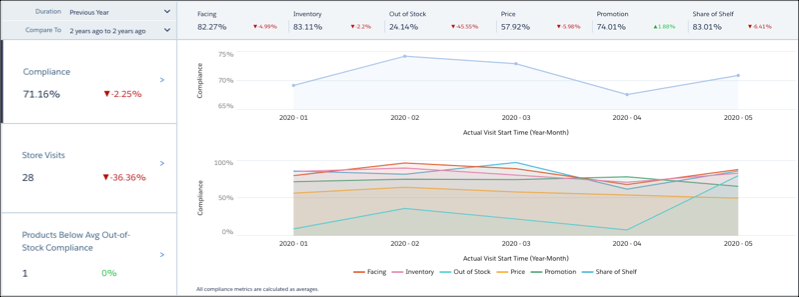
Store - Embedded
The Store - Embedded dashboard answers the following questions about your stores.
- How are the store's visits, and compliance trending?
- How many products are performing below the average compliance of all stores and similar stores?
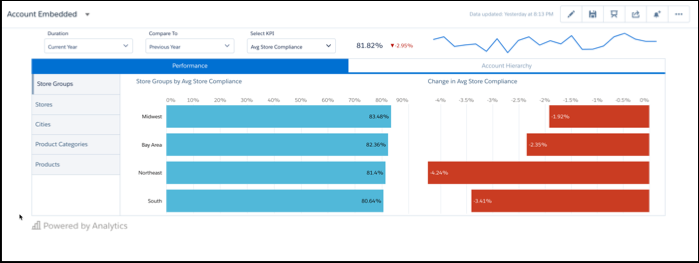
Account Embedded
The Account Embedded dashboard gives you instant insights into the performance of stores, store groups, products, categories, and descendants of an account. The dashboard answers the following questions about the account.
- How is my account and its descendants performing?
- What’s the change in my account’s performance compared to a previous period?
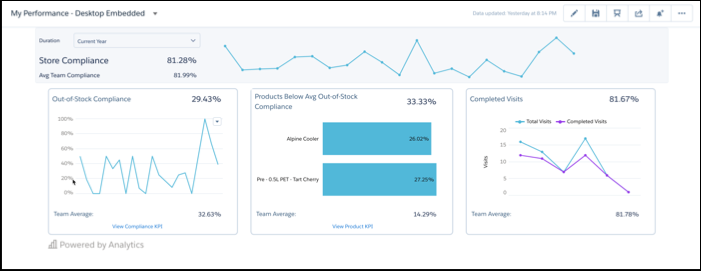
My Performance - Desktop Embedded
The My Performance - Desktop Embedded dashboard lets sales reps track their performance and compare it with their team’s average performance. The dashboard answers the following questions about a sales rep.
- How am I performing compared to my team’s average?
- Which of my products are below average compliance?
If you haven’t applied security predicates to your app, the team averages that you see in this dashboard are based on your user role hierarchy.
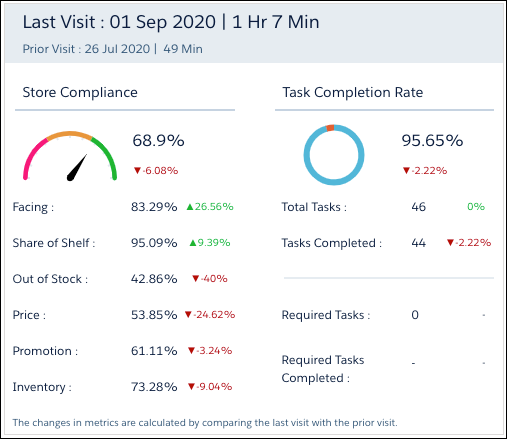
Last Visit Store Performance - Desktop Embedded
The Last Visit Store Performance - Desktop Embedded dashboard gives you actionable insights from your last store visit. The dashboard answers the following questions about your last store visit.
- What’s the store compliance?
- What’s the task completion rate?