
You are here:
Data Stream Control Center
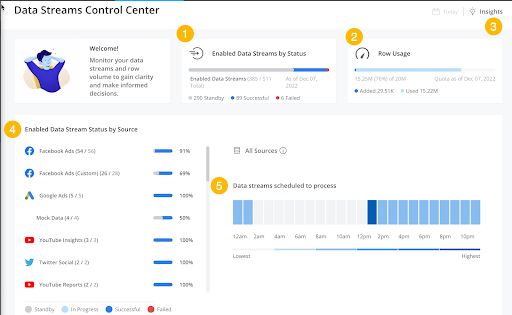
The Data Stream Control Center is a dashboard that centralizes data stream management into a single view. You can assess stream status, evaluate data quality, and identify ingestion issues. Get actionable insights for improved data hygiene and row management. The Data Stream Control Center is automatically filtered to show data for Today. To view the Data Stream Control Center dashboard, in the Connect & Mix tab, expand the Control Center tab.
-
Enabled Data Streams by Status: View the total number of
data streams processed in the past 24 hours, broken down by status.
- Standby—no retrieval method or scheduled hour to run.
- In Progress—data streams currently being processed.
- Successful—data streams that processed successfully.
- Failed—data streams that were unable to process.
-
Row Usage: View a breakdown of the rows in your
workspace.
- Added—total number of rows added to a workspace today.
- Used—number of rows in use in the workspace.
-
Insights: When new insights are available, the Insights
button is blue. There are several types of insights, for example:
- Disabled Data Streams—a data stream was disabled by the platform in the past three days.
- The size or number of rows in this file is close to exceeding the permitted size—oversized files will fail to process.
- Data streams that didn’t retrieve new files—After seven days of processing this stream, the stream didn’t retrieve or receive new files for two consecutive days.
-
Enabled Data Stream Status by Source: Quickly view all
the connected data sources in the workspace and their processing status over the
past 24 hours.
- Standby—no retrieval method or scheduled hour to run.
- In Progress—data streams currently being processed.
- Successful—data streams that processed successfully.
- Failed—data streams that were unable to process.
-
Data Streams Scheduled to Process Heat Map: The heat map
displays the number of data streams scheduled to run or that have run, broken
down by hour. The data displayed is for the past 24 hours. Only data streams
with a scheduling hour appear in the heat map table.
-
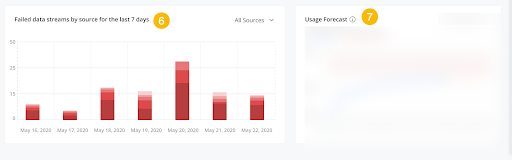
Failed Data Streams by Day: Data filtered on statistics
processed in the last seven days (including today). Hovering over each day shows
the total number of data streams that failed. You can filter the widget based on
the data source. To see additional information, hover over the bar chart.
- View Error type—click to show the total number of data streams grouped by error type for this day.
- View in Data Stream List—click to redirect to the data stream list. The list is filtered on the data streams that failed on this specific day.
-
Usage Forecast: The number of rows added to your
workspace over the last six months and a row usage forecast for the next three
months.
Did this article solve your issue?
Let us know so we can improve!