
You are here:
Run the Media Pacing App
After you install the Media Pacing app you can start visualizing your IO data. This allows you to easily and efficiently identify under and over pacing campaigns.
Required Editions
| User Permissions Needed | |
|---|---|
| To view installed Marketplace apps: | Admin, Power User, and Viewer |
The IOs are presented using color coding, allowing you to immediately identify how well each IO is pacing. The color coding is based on a calculation of the Actual Spend to date, as a percentage of the Expected Spend to date, and is governed by the following key:
< 70% = ‘Under pacing’, color: Red
> 70% and < 90% = ‘Pacing Risk’, color: Orange
> 90% and < 110% = ’Pacing On Track’, color: Green
>110% = ‘Over pacing’, color: Purple
-
To open the app, go to your Workspace Apps and double-click. Notice in this example that
the overall actual spend to date isn’t in line with the originally planned spend, resulting in
under pacing.
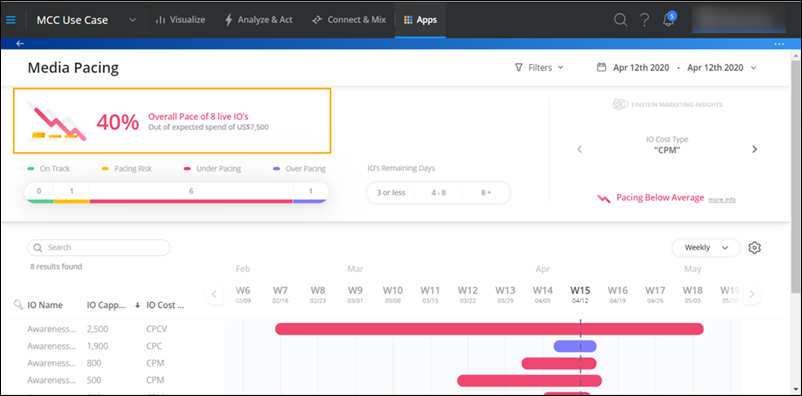
- To view only Under Pacing and Over Pacing IOs, change the filters under the overall score.
-
Change the date range at the top-right corner of the page if necessary. A few notes about
the date range:
 Note
Note- Out of all the IOs that were active within the selected range, the earliest IO Start Date, and the latest IO End Date serve as the two extremities for the IO visualization.
- All IOs that had any activity within the date range are visualized on the timeline view, each with its own Start and End Date.
- There’s an option Show Only Live IOs. An IO is considered to be Live only if it’s active on the Current Date on which you’ve accessed the app. If the current date resides between an IO’s start and end dates, it’s visualized. Each IO is visualized with its own Start and End dates. This option allows you to instantly focus your view on IOs that are currently active and therefore require your attention more urgently than others.
- In the Timeline view, focus on the IOs that require further monitoring to see what’s causing misalignment between the actual and planned data. Here you can see information about the IO, including IO Name, Capped Cost (budget), and IO Cost Type by default.
-
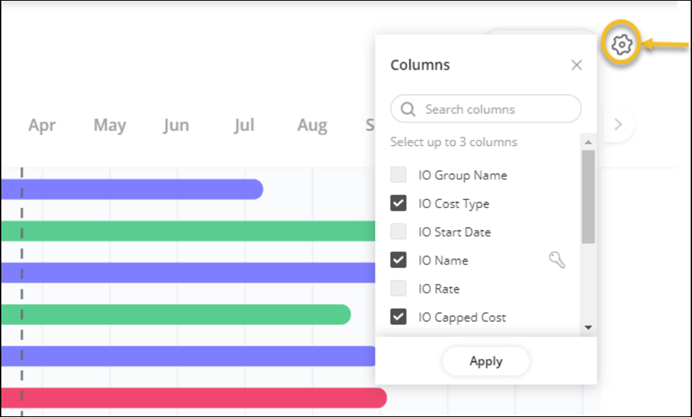
To change the columns, click the cogwheel and select the names you require. You can display
up to three columns.
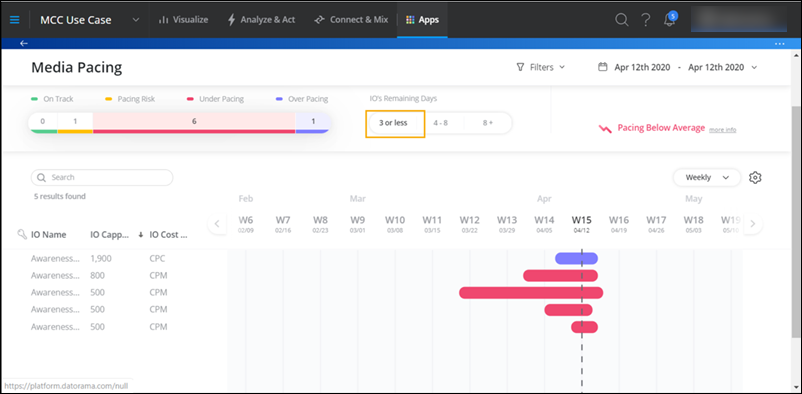
- By default, the timeline display is at a Monthly breakdown, but you can change it to Weekly or Daily breakdowns.
-
In IOs Remaining Days, filter by remaining days, for example, view
IOs that have less than 3 days left.
-
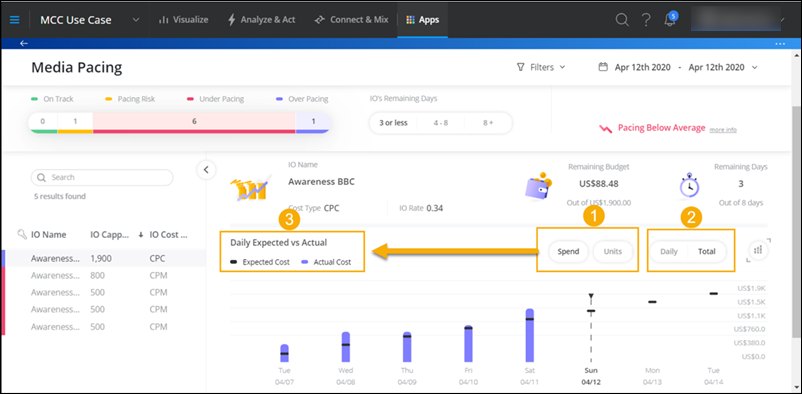
To drill down, click a specific IO.
 Note
Note- There are two important filter options here, which dynamically change the view and the title of the graph (3). (1) Spend/Units and (2) Daily/Total.
- The app considers this IO to be over pacing because the actual cost is higher than the expected cost. After analyzing the Total aggregation mode, switch to Daily view and see on which actual days the spend exceeded what was planned, in order to try and understand what caused the over pacing.
- To see the absolute values of each of the measurements and the difference between them, hover over a specific day.
- Click the stacked view and view the actual media buys that generated activity on each day. They appear stacked on the bars of the graph.
- Hover over an IO and view the media buy name. When media buy stacking is on, you can also see the top 5 media buys that generated the most spend or have delivered the most units (depending on your current focus). Spot the days on which a certain media buy was active and the activity that it generated.
-
Investigate an under pacing IO. Notice there’s an IO with no media buy associated with it,
therefore it’s underpaying.
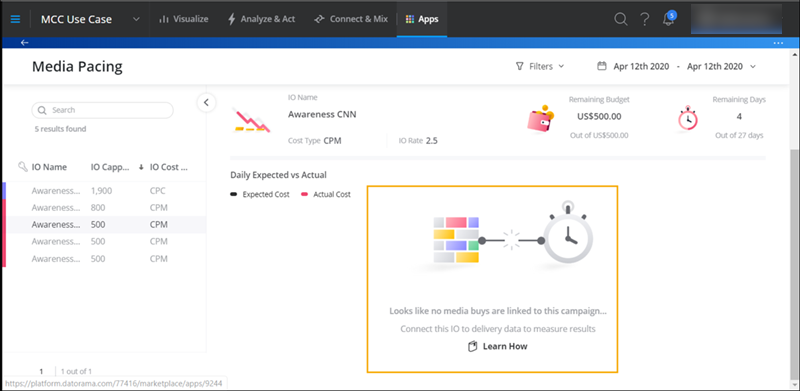 Ask your Marketing Cloud Intelligence admin to look into it and make the required association in the MTC implementation within the workspace.
 - The Media Pacing app also provides an option so you can view out of the box EMI (Einstein Marketing Insights) that are pre-configured for your IOs. This is located below the date picker and shows all insights that were found. You can click an insight, which directs you to the EMI page so you can view more information about a specific insight.
Heeft dit artikel uw probleem opgelost?
Laat ons weten wat we kunnen doen om te verbeteren!