
You are here:
Forecasting
Forecasting allows you to activate sophisticated algorithms that predict the behavior of a specific measurement.
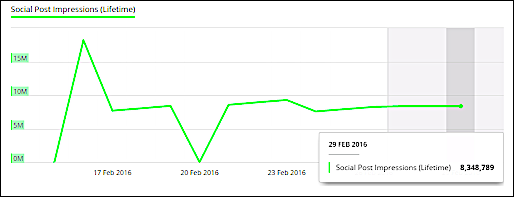
Predicted values are displayed in their relevant dates, and the background color of the forecasting period appears slightly darker, as you can see in this image:
For optimal forecasting, follow these key principles:
- More data is better — The larger the window of time your forecast is based on, the greater the likelihood for accuracy. For example, querying a weekly data slice from within a single month produces a less accurate forecast than querying daily data from across an entire quarter.
- Recurring patterns — Data that exhibit repeatable patterns yields more accurate and confident forecasts.
- Continuous data — Missing data periods in your query result in an estimation by the forecasting algorithms, which can affect forecast accuracy.
- Minimal number of outliers — Data sets with a minimum number of outlier values yield more accurate and confident forecasts.
When activating forecasting, the platform automatically runs two different forecasting models and selects the one with the highest quality.
The forecasting models use the R Forecasting Package and have two available algorithms:
The Forecasting Quality Score (FQC) is determined by calculating the Mean Absolute Scale Error (MASE) for each of the algorithms and then normalizing it to get a score 1–100. The forecasting method with the highest score is selected.
- Activate Forecasting
Forecasting is available within the bar graph widget when using a date dimension (day, month, or week).