
You are here:
Create a Goal Widget
After you create a goal in your workspace, you can visualize the goal using a goal widget. A goal widget can only be set up if you have a goal in your workspace.
Required Editions
Goal values are calculated by the Average Daily Goal Value multiplied by Elapsed days and appear differently depending on the selected widget.
In Goal Table Widgets, values are calculated using the number of days in the widget or page date range. For example, if today is December 27, 2023, but you're viewing a date range of December 1-31, the goal calculation uses 31 elapsed days.
In Goal Gauge Widget values never exceed the current number of elapsed days when calculating the goal. For example, if today is December 27, 2023, but you're viewing a date range of December 1-31, the goal calculation uses 27 elapsed days
.
| User Permissions Needed | |
|---|---|
| To create a widget: | Admin or Power User |
- In the Visualize tab, double-click the page that you want to create a goal widget on.
- Click the pencil icon, and then click the plus icon.
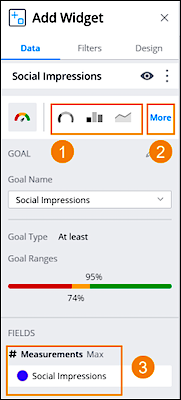
- To add a widget, select the goals widget from the Add Widget menu. The default widget for goals is a gauge.
- To change the widget type, click the suggested options next to the gauge (1).
-
To view additional widget options, click more (2). Add the measurements and dimension, or
add both (3).
- To create a Goal Table widget, select the goal table from the goal widget menu.
-
Name your goal, and add pacing fields. Pacing measurements allow you to add granularity and
focus on the performance of your goals. Adding a pacing field affects the visualization of the
goal widget. These pacing measurements are available:
Measurement Value The value of the measurement that the goal is targeting. For example, if the goal measurement is clicks and the goal is set to reach 200 clicks, the measurement value is 200. Period Start The goal start date. Period End The goal end date. Goal Value The target number the goal measurement is set to achieve. Remaining Value How much of target value is left in order to achieve the goal. Period Days Elapsed How many days have passed since the start date. Period Days Left How many days are left until the end date. Daily Target The number the measurement must reach daily in order to reach the goal. (Total goal value - current measurement value) / # of days left = Daily Target Daily Average Value The daily average achieved up until now. To calculate this number, divide the measurement value by the period days elapsed. Daily Average Goal The number the measurement must reach every day in order to achieve the goal. Predicted Value Calculates the predicted value that the measurement reaches at the end of the goal period or at the end of the page or widget’s date range. (Total relevant Measurement’s value until today * Total Days for the goal’s period / # of days passed since the goal’s start period = Predicted)
If the goal’s period ends after the page or the widget’s defined date range, the total days for the goal’s period are calculated through the last day of the widget or page’s date range.
Delivery rate The current performance rate of the goal. - To apply filters to your goal, click the Filters tab on the Add Widget menu.
-
To inherit the page filters, select Inherit Page Filters checkbox.
This checkbox allows the goal widget to take on the same date range as the page. However, data
is only displayed if the page’s date range is within the goal’s date range.
For example, your goal’s date range is between January 2022 and June 2022. If the goal is set to inherit page filters, and the page is set to display data between January and February 2022, the goal automatically updates and reflects that date range. If the page is set to display data for July 2022, the goal doesn’t display any data because this date range is outside of the goal’s defined date range.
- Save your Table Goal widget.