Use a pivot table to explore and extract data. For example, you can get sends and open
rates for all your emails to see how well a specific email performed. You can also export a pivot
table locally or use it to create a scheduled report.
Required Editions
Available in: Intelligence Reports and Intelligence Reports Advanced
User Permissions Needed
To create or export pivot tables
Access, View & Export, Schedule, Create & Edit
To save, edit, and delete pivot tables
Create & Edit
You can also create a pivot table directly from a widget in the Dashboards tab. For more
information, see Create a Pivot Table from a Widget.
In Analytics Builder, select Intelligence Reports.
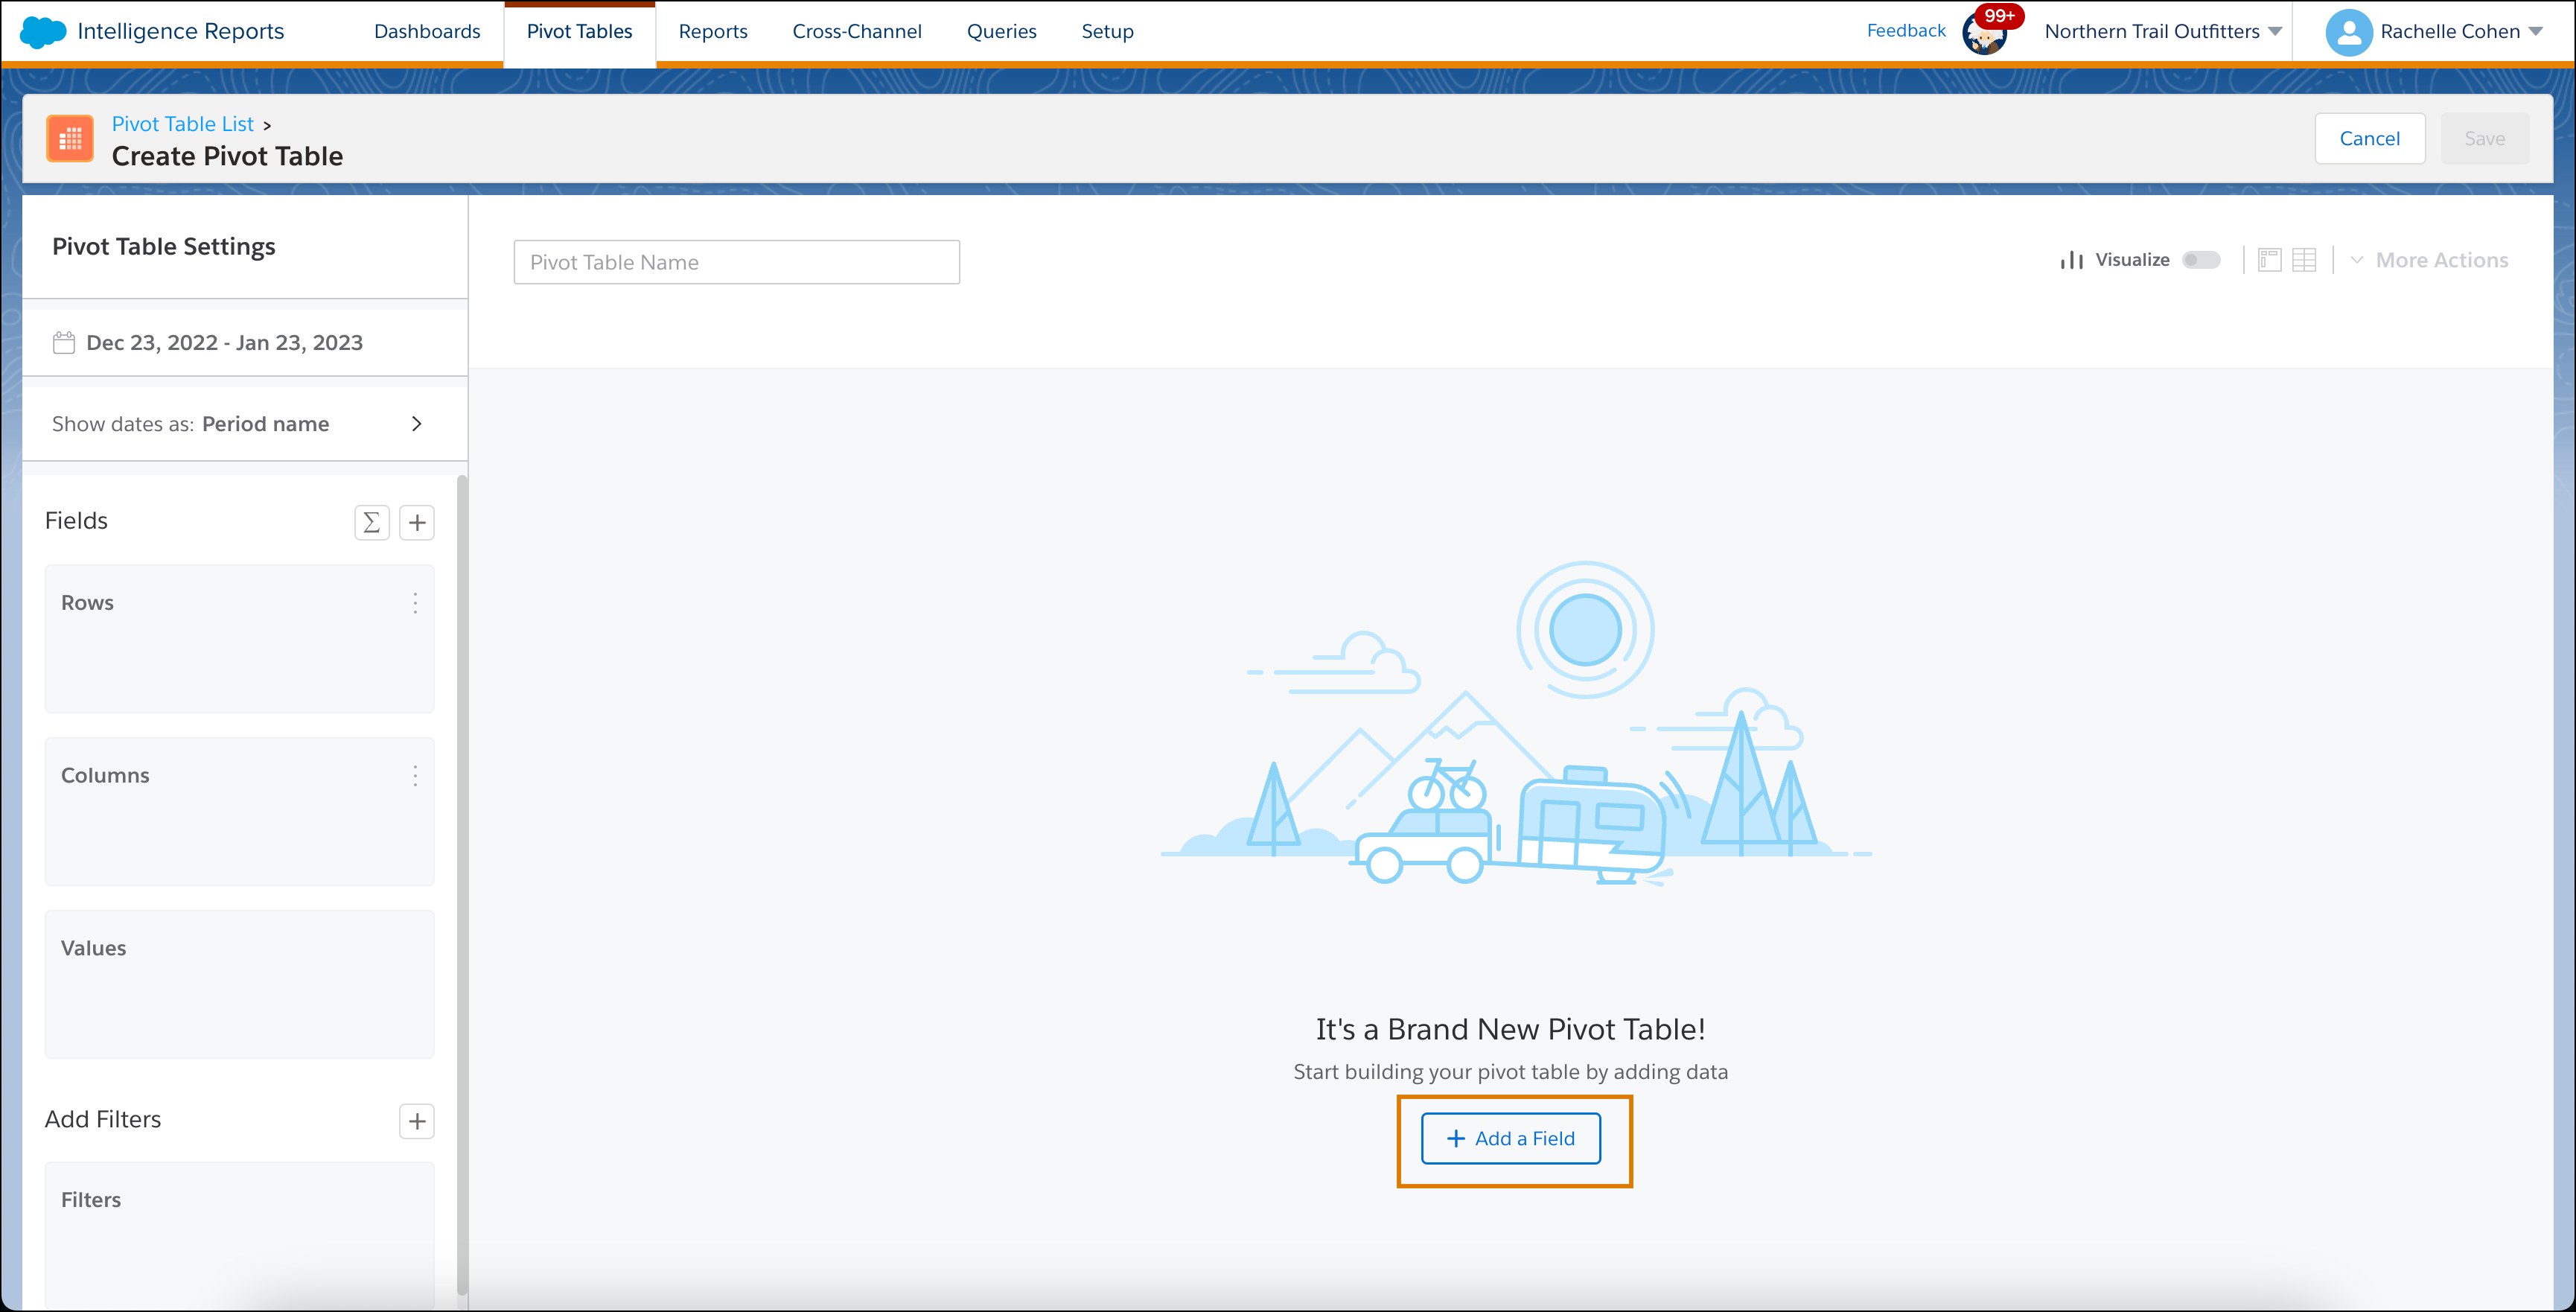
On the Pivot Tables tab, click Create Pivot Table.
To add data to the pivot table, click + Add a Field.
When adding data, Dimensions are always placed in
Rows or Columns, while Measurements are always placed in Values. The pivot table changes as you
add or remove data.
When you’re done adding data, close the Add Data window.
In the Pivot Table Settings window, set the date range for the data
that you want to view.
To apply a filter, in the Filters section, click the
+ icon and set your filters.
You can also apply a filter inside the pivot table in the column header.
If you have Intelligence Reports Advanced, you can create and edit calculated fields by
clicking the Add Calculated Field icon. For more information, see Add Data to Your Widget .
Name the pivot table.
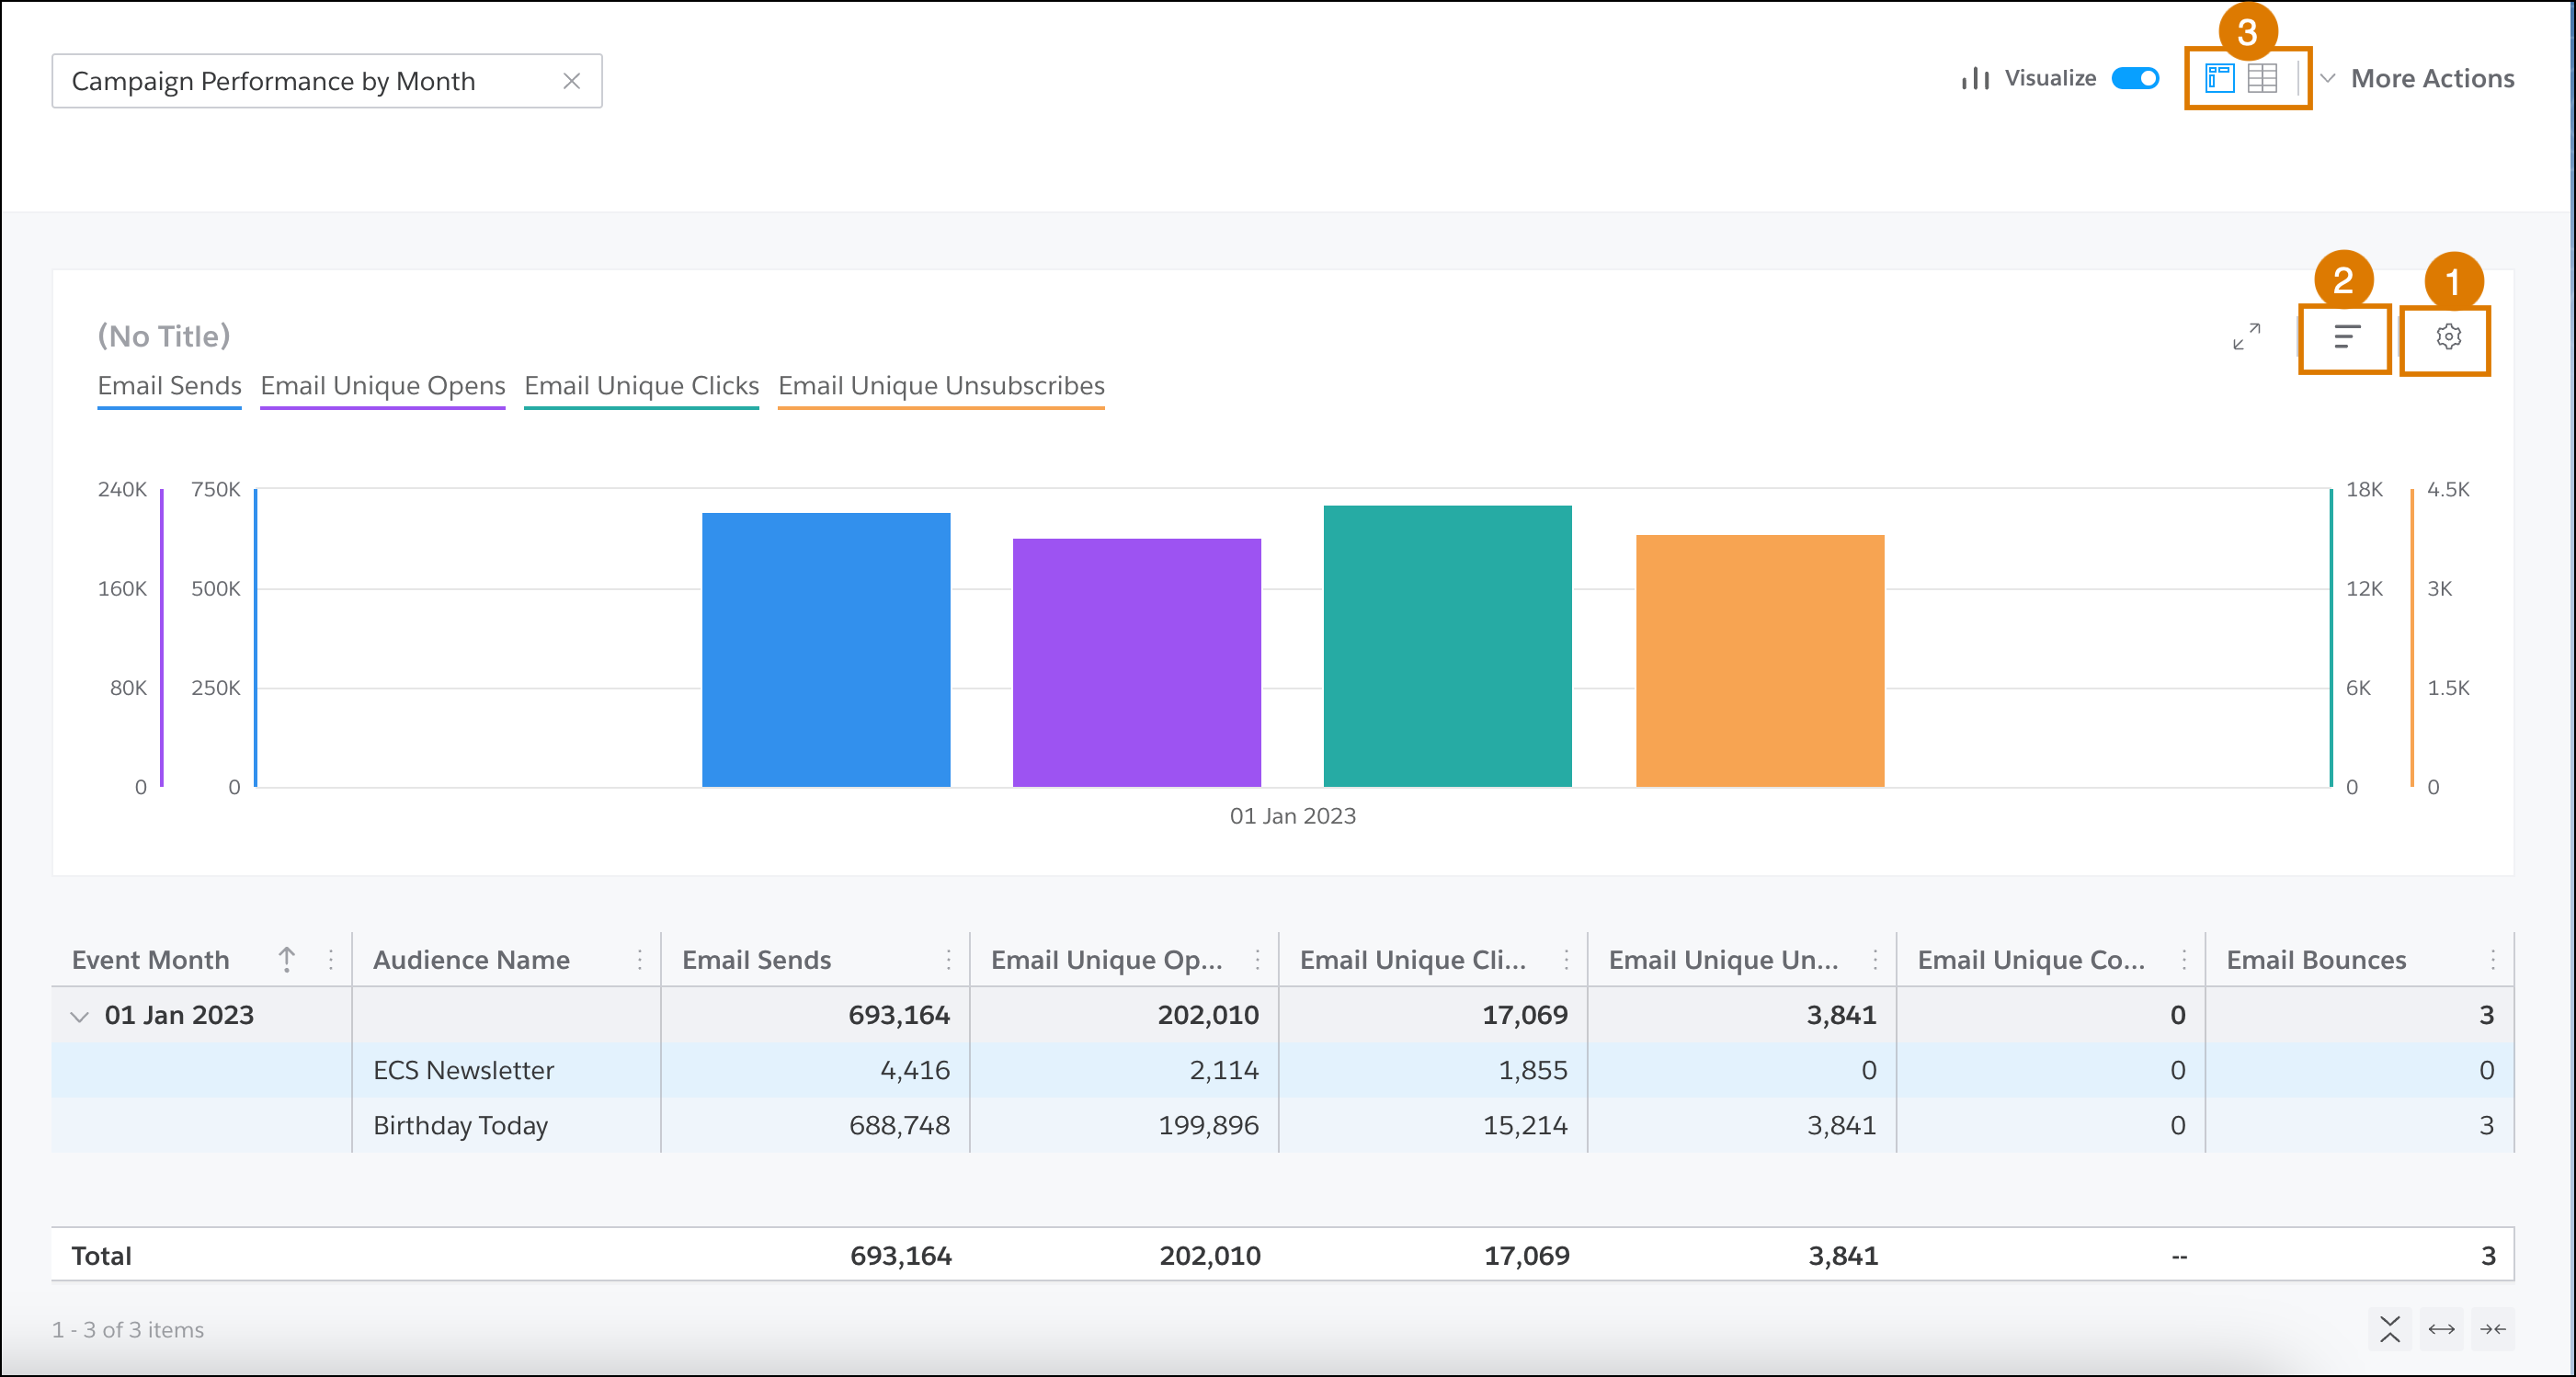
To visualize your data in a chart, turn on Visualize.
To show specific dimensions and measurements, or to change the display, click
Chart Settings (1).
To change how the results are sorted, click Chart Top and Sorting
(2).
To view the pivot table as a flat table, click the flat table icon (3).
To save, export, or download your pivot table, click More Actions.
Save your work.
The new pivot table appears in the Pivot Tables list, and you can edit, delete, and export
it.
Did this article solve your issue?
Let us know so we can improve!
Loading
Salesforce Help | Article
Cookie Consent Manager
General Information
Required Cookies
Functional Cookies
Advertising Cookies
General Information
We use three kinds of cookies on our websites: required, functional, and advertising. You can choose whether functional and advertising cookies apply. Click on the different cookie categories to find out more about each category and to change the default settings.
Privacy Statement
Required Cookies
Always Active
Required cookies are necessary for basic website functionality. Some examples include: session cookies needed to transmit the website, authentication cookies, and security cookies.
Functional Cookies
Functional cookies enhance functions, performance, and services on the website. Some examples include: cookies used to analyze site traffic, cookies used for market research, and cookies used to display advertising that is not directed to a particular individual.
Advertising Cookies
Advertising cookies track activity across websites in order to understand a viewer’s interests, and direct them specific marketing. Some examples include: cookies used for remarketing, or interest-based advertising.