
You are here:
Logs Tab
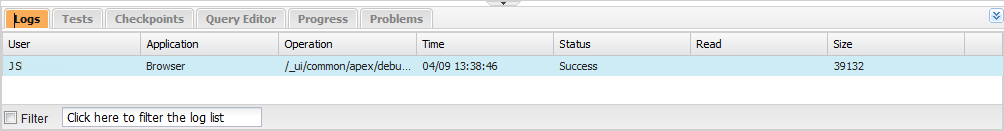
Use the Logs tab in the Developer Console to access logs that include database events, Apex processing, workflow, callouts, and validation logic.
The Developer Console automatically polls for the current user’s debug logs and lists them on the Logs tab. For example, if you have validation rules associated with inserting a record and you insert a new record, the Developer Console captures a debug log for the request and adds it to the list.
- To open the selected log in the Log Inspector, select or double-click the log on the Logs tab. Use the Log Inspector to review a debug log, evaluate Apex code, track DML, monitor performance, and more.
- To open the selected log in a text editor, select . Or, right-click a log on the Logs tab and select Open Raw Log. String values that are truncated to 512 characters in the Log Inspector aren’t truncated in raw logs.
- To filter the visible logs, click Filter and type the text you want included in the list. For example, if you want to see debug logs from a specific user, type that user's name. The filter is case-sensitive.
- To remove all logs from the list, click .
- By default, the Logs tab displays only new logs generated by the current user. To see all debug logs saved for your organization, including newly generated logs created by other users, click Debug and deselect Show My Current Logs Only.
- To automatically hide all existing logs the next time the page is refreshed, click Debug and select Auto-Hide Logs.
- To download a copy of the selected log as a text file, click . The default name for the file is apex.log.
- To prevent logs from loading when you open the Developer Console, go to and set Prevent Logs on Load to true.
Setting Logging Levels
Logging levels determine how much request information is saved in a debug log. Parsing a large log can take a long time. To reduce the size of a log, adjust the logging level. Use verbose logging for code you’re reviewing. Use terse logging for code you’re not interested in.
To override the default log levels for a specific class or trigger, or to set up logging for a user, add a trace flag that includes a duration and a debug level.
To save your changes and close the window, click Done.