
You are here:
Test or Troubleshoot Flows with the Flow Builder Debugger
If you’re testing your flow to make sure that it works as expected or troubleshooting a failed flow, the Debug option in Flow Builder can be your best friend. Review step-by-step details of how your flow runs and the path the flow takes.
Required Editions
| View supported editions. |
| User Permissions Needed | |
|---|---|
| To debug a flow in Flow Builder: | View All Data |
| To open, edit, create, activate or deactivate a flow using all flow types, elements, and features available in Flow Builder, including Einstein and Agentforce for Flow: | Manage Flow |
Warning
If you debug a flow without selecting Run flow in rollback mode, the
flow performs its actions, including any Data Manipulation Language (DML) operations and
Apex code execution. Remember, closing or restarting a running flow doesn’t roll back its
previously executed actions, callouts, and changes committed to the
database.
Watch this video to learn the advantages of the Flow Builder debug feature and get tips for using it effectively.
View this video in a separate tab.
The Flow Builder debug option has some limitations. See Flow Builder Debugger Considerations.
To use generative AI to diagnose errors and automatically apply fixes, see Troubleshoot Flow Errors with Agentforce (Beta).
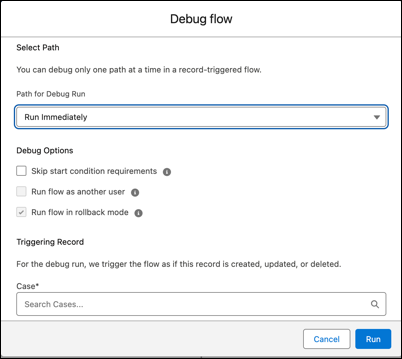
- Open the flow in Flow Builder.
- Click Debug.
-
Set the debug options and input variables.
The debug options vary depending on the flow type.
-
To debug the flow as another user, turn on debugging as another user.
- From Setup, in the Quick Find box, enter Process, and then click Process Automation Settings.
- Turn on Let admins debug flows as other users.
-
Save your work.
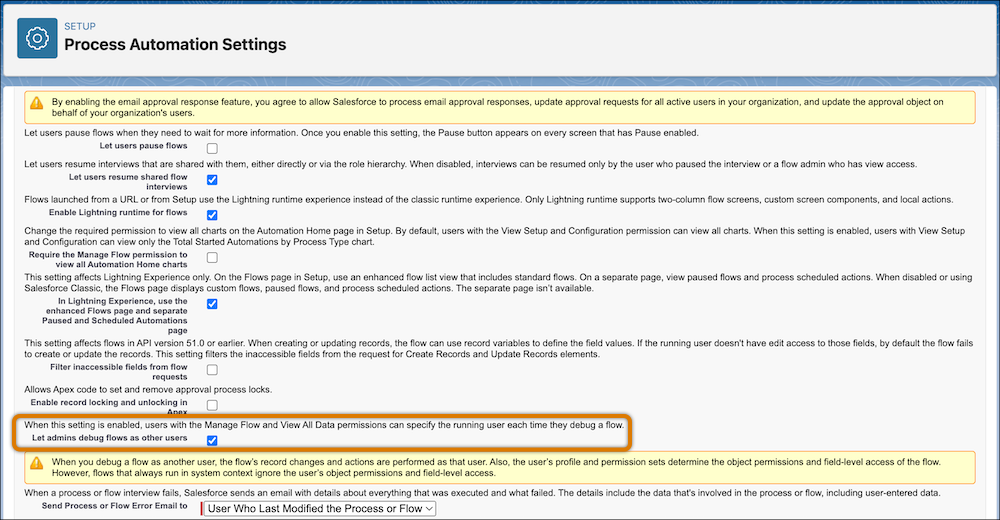
 Warning When you debug a flow as another user, the flow makes record changes and performs actions as that user. Also, the user’s profile and permission sets determine the object permissions and field-level access of the flow. However, flows that always run in the system context ignore the user’s object permissions and field-level access.
 -
In Debug Options, select Run flow as another user and search
for the user that you want to debug.
You can debug a flow as another user only in a sandbox environment.
-
Click Run.
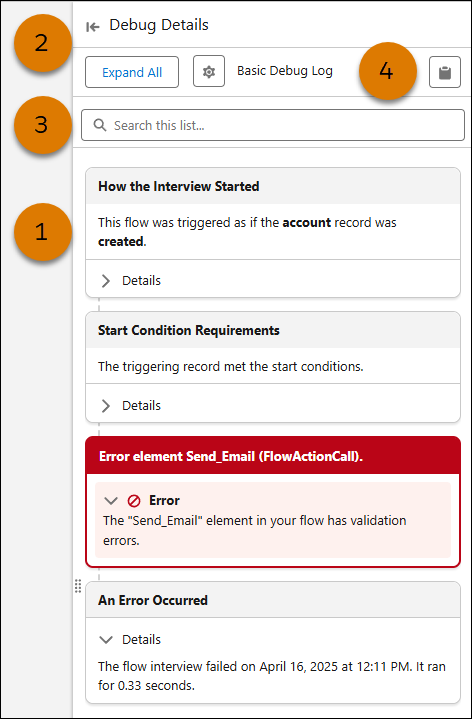
The debug details for the run appear in the right panel. The debug run is organized into cards (1) that highlight key information about the run. To resize the debug panel, drag the edge of the panel to your desired width, or click
 and
and  (2). To search the debug run results, enter a search term in the search box (3).
To copy the debug log to your clipboard, click
(2). To search the debug run results, enter a search term in the search box (3).
To copy the debug log to your clipboard, click  (4).
(4).
 Note From the Debug Details panel, you can also click Ask Agentforce (Beta) to get an AI-generated root cause analysis and optionally apply an automatic fix. See Troubleshoot Flow Errors with Agentforce (Beta).
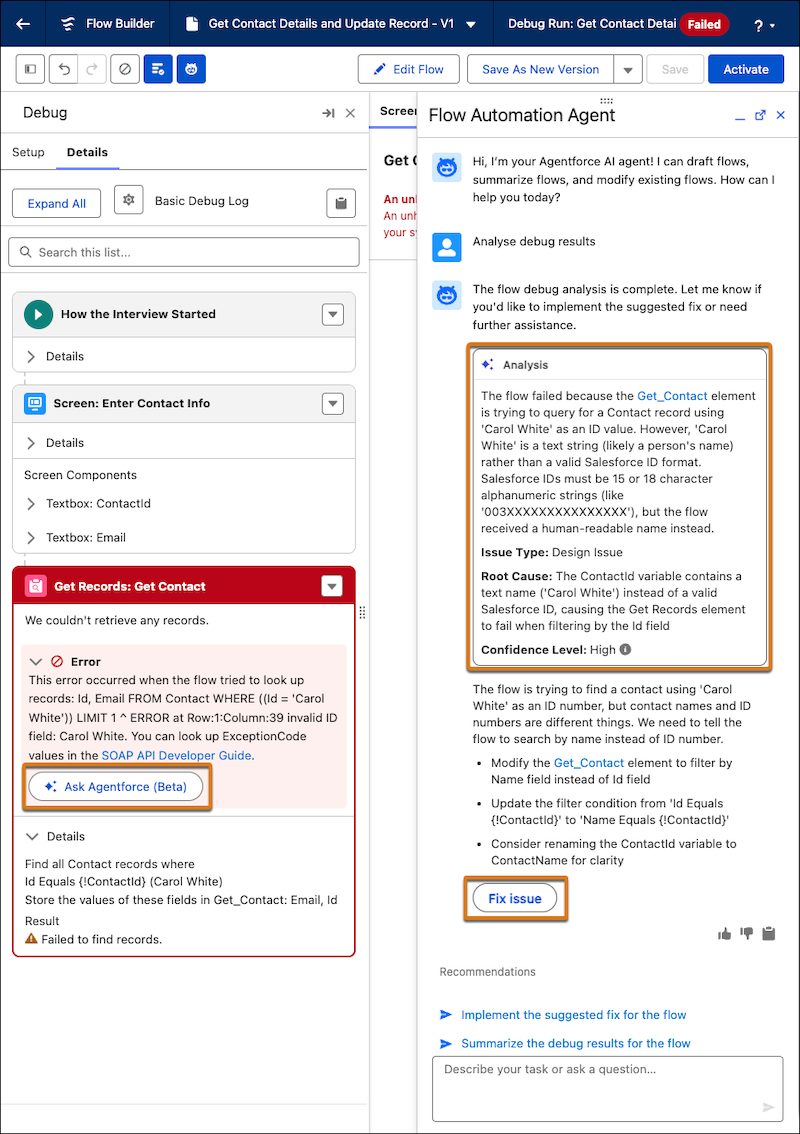
-
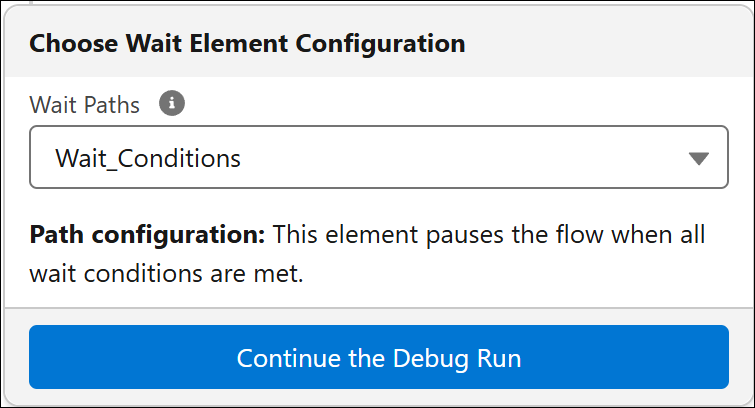
If you selected Debug wait element behavior when you set the debug options, select a
Wait Path, and then click Continue the Debug Run
for each Wait element in the flow.
The debug details for the run appear in a panel on the right.
- (Optional) To restart the flow by using the same or different values for the input variables, click Debug Again.
- (Optional) To convert the debug run to a test in a record-triggered flow only, click Convert to Test.
- Debug a Template-Triggered Prompt Flow Example
Debug a prompt flow that integrates with a prompt template that generates a list of events. - Troubleshoot Flow Errors with Agentforce (Beta)
Use Agentforce to troubleshoot design-time issues in saved flows and run-time errors in active flows, eliminating the need for manual troubleshooting. The Flow Automation agent diagnoses issues, identifies root causes, and explains remediation steps all in natural language. In some situations, the Flow Automation agent can automatically fix the flow for you.
See Also
Did this article solve your issue?
Let us know so we can improve!