You are here:
Use Einstein Account Management
Einstein Account Management provides dashboards and Einstein Discovery models to help you see which of your accounts has potential and which accounts have product white space. You can also see which of your accounts need attention.
Required Editions
| Available in: Revenue Intelligence, which is available for an additional cost in Enterprise and Unlimited editions. |
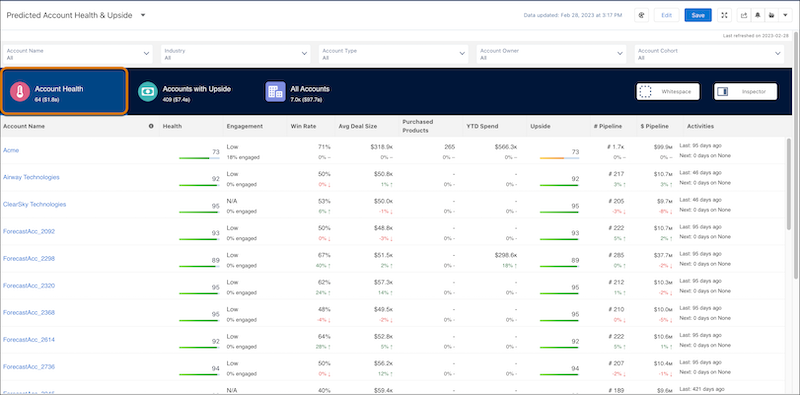
Use the Einstein Account Management table for a comprehensive view of your account health. Select Account Health to see accounts that need attention.
| ACCOUNT HEALTH KPI | CALCULATION |
|---|---|
| Health | Einstein Discovery Account Health. See the inspector view for top predictors. For a description of how the model is created, see the section, “Understand the Einstein Discovery Health Model.” |
| Engagement | Number of total contacts compared to contacts engaged on activities. |
| Win Rate | Percentage of opportunities won compared to opportunities closed. |
| Avg Deal Size | Average sum of amount for closed won opportunities. |
| Products Purchased | The number of unique products purchased. |
| YTD Spend | Total amount of closed won opportunities year to date. |
| Upside | Einstein Discovery Account Upside. See the inspector view for top predictors. |
| Pipeline # | Open number of opportunities by count. |
| Pipeline $ | Open number of opportunities by total amount. |
| Activities | Past and future Activities (include tasks and events). |
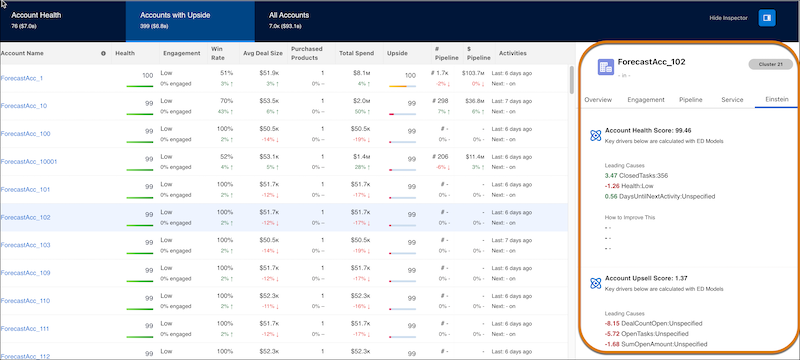
Click Accounts with Upside to see Accounts with upside potential, and click Show Inspector to see the predictions based on the ED models.
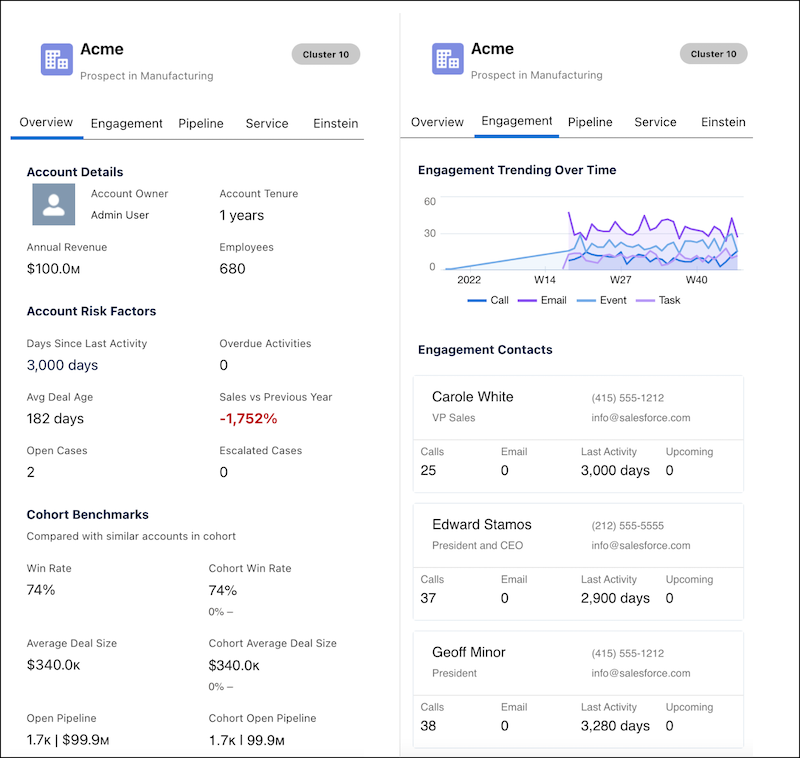
When you open the Account Inspector, you can see predictions for individual accounts, including scores and the types of events that impacted that score. Click each of the tabs to see more details for Overview, Engagement, Service, and Einstein.
| ACCOUNT UPSIDE KPI | CALCULATION |
|---|---|
| Engagement | Number of total contacts compared to contacts engaged on activities. |
| Win Rate | Percentage of opportunities won compared to opportunities closed. |
| Avg Deal Size | Average sum of amount for closed won opportunities. |
| Products Purchased | The number of unique products purchased. |
| YTD Spend | Total amount of closed won opportunities year to date. |
| Upside | Einstein Discovery Account Upside model. See the inspector view for top predictors. For a description of how the model is created, see the section, “Understand the Einstein Discovery Account Upside Model.” |
| Pipeline # | Open number of opportunities by count. |
| Pipeline $ | Open number of opportunities by total amount. |
| Activities | Past and future Activities (include tasks and events). |
| ACCOUNT INSPECTOR OVERVIEW | CALCULATION |
|---|---|
| Total Sales | Number of total contacts compared to contacts engaged on activities. |
| Annual Revenue | Standard field on account layout. |
| Employees | Standard field on account layout. |
| Account Tenure | Number of days or years since account creation. |
| Days Since Last Activity | Standard field on account layout. |
| Overdue Activities | Number of activities where ActivityDate is in the past and is still open. |
| Avg Deal Age | Avg of Opportunity Age (Customer Insights derived column). |
| Sales vs. Previous Year | Closed won opportunities YTD compared to previous years - (CurrentYearWon - PreviousYearWon) / CurrentYearWon. |
| Open Cases | Number of open cases linked to account. |
| Escalated Cases | Number of escalated open cases linked to account. |
| ACCOUNT INSPECTOR ENGAGEMENT | CALCULATION |
|---|---|
| Calls | Number of total contacts compared to contacts engaged on activities. |
| Emails | Standard field on account layout. |
| Last Activity | Standard field on account layout. |
| Upcoming | Number of days or years since account creation. |
| ACCOUNT INSPECTOR PIPELINE | CALCULATION |
|---|---|
| Open Deals | Number of open opportunities. |
| Open Pipeline | Open Opportunity Amount. |
| Lost Deals | Total Opportunities closed where IsWon = false. |
| Lost Amount | Total opportunity amount where IsWon = false. |
| ACCOUNT INSPECTOR SERVICE | CALCULATION |
|---|---|
| Open Cases | Number of open cases linked to account. |
| Closed Cases | Number of closed cases linked to account. |
| Escalated Cases | Number of escalated cases linked to account. |
| Avg Days Open | Avg number of days a case is open. |
Click Whitespace to see accounts with product whitespace.
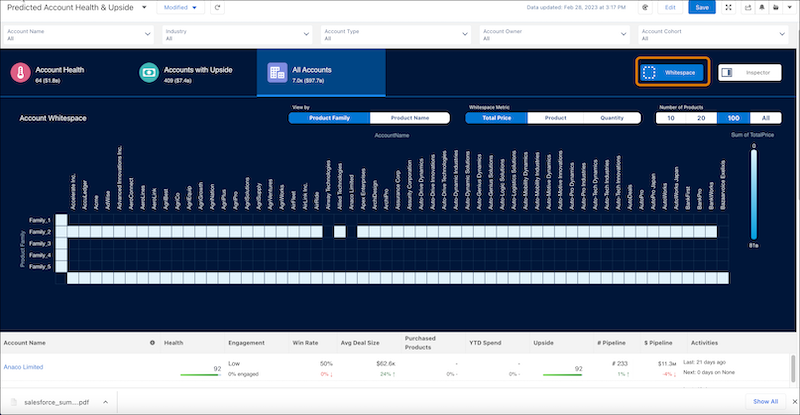
| WHITESPACE | CALCULATION |
|---|---|
| Sum of total price | Sum of total price from the Opportunity Line Items. |
| Count of product | Count of products sold, sorted by account from the Opportunity Line Items. |
| Sum of quantity | Sum of products sold, sorted by account from the Opportunity Line Items. |
Understand the Einstein Discovery Account Health Model
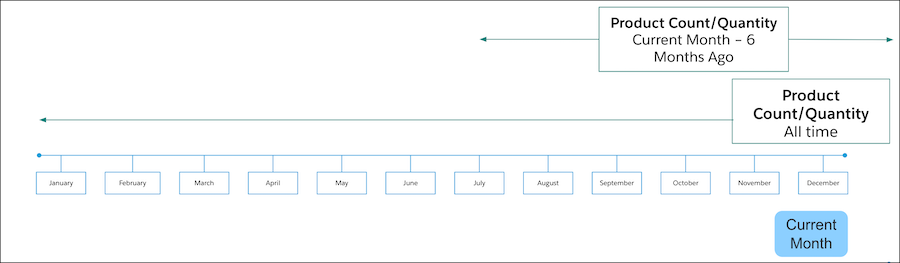
The recipe for the Einstein Discovery Account Health model calculates the win rate for each account for two time periods. The first period is the current month to 6 months ago. The second period is from 6 months to 12 months ago. If the win rate for the account has gone up between those two time periods, the Spend Health value is equal to high. If the win rate has gone down, it equals to low.
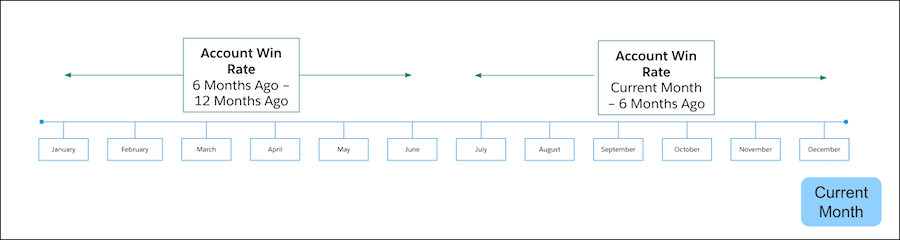
Understand the Einstein Discovery Account Upside Model
By default, the recipe for the Einstein Discovery Account Upside model aggregates the number of products purchased and quantity for each account across two time periods. The first period is the current month to 6 months ago. The second period is looking at all time. If the product count or quantity for the account has gone up in the last 6 months, Product Health equals high. If the product count or quantity for the account has gone down, it equals to low.