
You are here:
Review Pipeline Forecasts Against Forecast Quotas
A forecast quota is the monthly or quarterly sales goal that’s assigned to a sales team member or territory. A manager’s quota equals the amount that the manager and team are expected to generate together. The quota rollup is done manually by users and managers, and revenue or quantity data can be used. If you have multiple types of forecasts enabled, each type maintains separate quota information.
Required Editions
| Available in: both Salesforce Classic and Lightning Experience |
| Available in: Professional, Performance, and Developer Editions and in Enterprise and Unlimited Editions with Sales |
A manager’s quota equals the amount that the manager and team are expected to generate together. The quota rollup is done manually by users and managers, and revenue or quantity data can be used. If you have multiple types of forecasts enabled, each type maintains separate quota information.
Quota data appears in these locations on the forecasts page.
- A column that contains quotas for a specific period. If your forecast includes product families or forecast groups, this column includes quotas for each product family or group
- A row that contains the percentages attained for a specific period in a specific forecast rollup.
Watch a brief video about how quotas and quota attainments work on the forecasts page.
Show and Hide Quotas in Pipeline Forecasts
If your Salesforce admin has set up quotas, you can show or hide quota data so that your forecasts page shows you the information that you need. The quota information can be revenue or quantity, depending on the type of forecast that you’re using. If multiple forecast types are available, each type maintains separate quota information.
Required Editions
| Available in: both Salesforce Classic and Lightning Experience |
| Available in: Professional, Performance, and Developer Editions and in Enterprise and Unlimited Editions with Sales |
| User Permissions Needed | |
|---|---|
| To show and hide quotas on the forecasts page: | View All Forecasts OR Allow Forecasting OR Delegated forecast manager status |
| To access role-based forecasts in Lightning Experience: | View Roles and Role Hierarchy |
Quota data appears in these locations on the forecasts page.
- A column that contains quotas for a specific period. If your forecast includes product families or forecast groups, this column includes quotas for each product family or group
- A row that contains the percentages attained for a specific period in a specific forecast rollup.
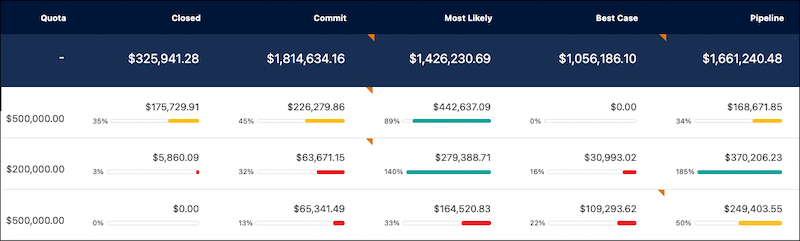
Quota attainment progress bars use these colors:
- Grey: 0%
- Red: From 1% through 33%
- Orange: From 34% through 66%
- Green: 67% and above
-
Do one of the following.
- If you’re using Lightning Experience, click the gear in the upper right of the forecasts page.
- If you’re using Salesforce Classic, click Display Options.
- To show your quota for each period, select Show Quota Column.
- To show your quota attainment for a specific rollup in a selected period, select Show Quota % Attainment. The percentage and progress bar shown below each forecast indicates the proportion of the user’s quota that the forecast represents.
- In product family forecasts, sales managers can’t see their own quotas and quota attainment for individual product families. Only their total quota appears in the rollup table. For example, if three sales reps have combined quota amounts of $75,000 and their forecast manager has an individual quota of $30,000, the manager’s quota is $105,000.
- In forecast types based on opportunity revenue or quantity, the quota value shown in the month or quarter row is the quota input for that month or quarter. For example, if a manager's quota is input as $500 for February, $500 is shown as the quota for February. The quota value in the Total row is the sum of the month and quarter values.
- In forecast types based on opportunity with user role or territory with product family, and in the My Territory summary view, the quota value shown in the month or quarter row is the sum value. For example, if a manager’s quota is $500 for February, and their single subordinate’s quota for February is $500, the quota shown for February is $1000. The quota value in the Total row is the sum of all month or quarter values.
- You can edit direct subordinates’ quotas only (“Manage Quotas” permission required)—not your own.
- In territory forecasts, quotas can be assigned to the forecast manager if one is defined. If the territory doesn’t have a forecast manager, quotas can be assigned to a user who is a member of the territory.