Loading
Manage Your Billing Processes with Salesforce Billing
Table of Contents
Select Filters

          No results
          No results
          Here are some search tips

          Check the spelling of your keywords.
          Use more general search terms.
          Select fewer filters to broaden your search.

          Search all of Salesforce Help
          The Lifecycle of a Subscription Asset

          The Lifecycle of a Subscription Asset

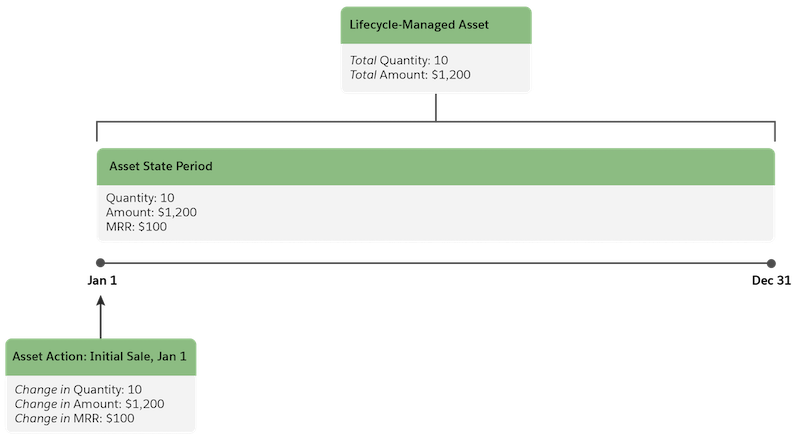
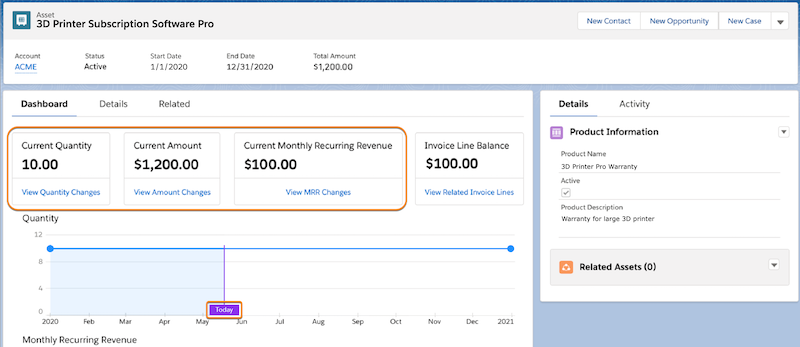
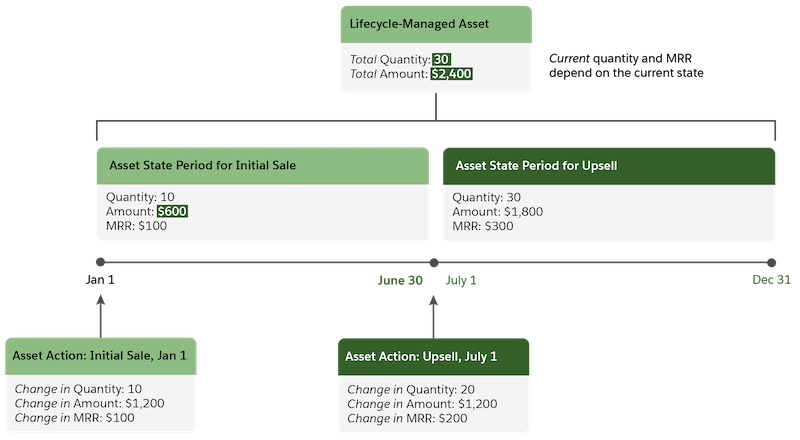
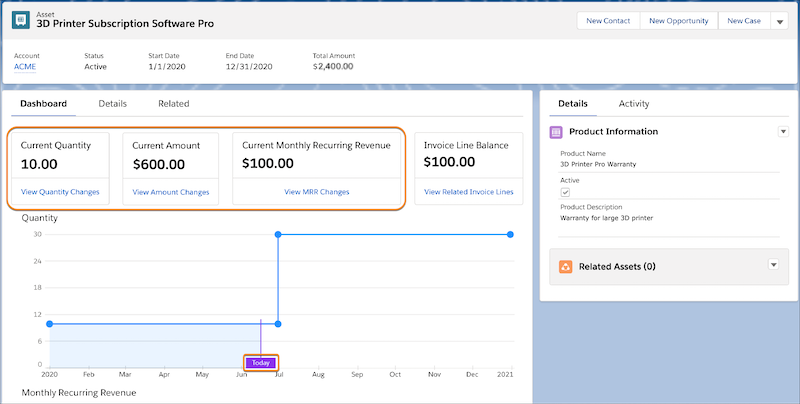
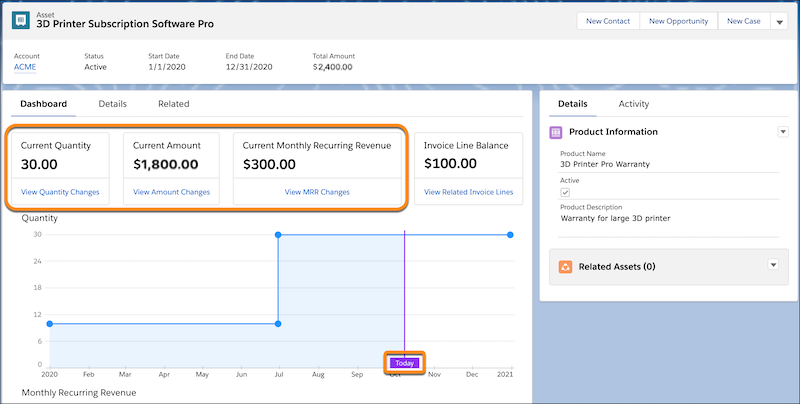
          When customers buy a subscription product, they can add to, upgrade, or cancel the subscription over time. Customer Asset Lifecycle Management represents these changes through asset actions, and one or more asset state periods. An asset action represents a change to quantity, amount, and monthly recurring revenue (MRR). An asset state period represents the time span when a change applies to an asset, forming a timeline of the asset’s lifecycle. Depending on where today’s date falls within this timeline, the dashboard shows a period’s quantity, amount, and MRR as current. A nightly background process compares the current date to the start dates of the asset state periods. If the system finds a match, it updates the dashboard and related pages, labeling the next period’s data as current. (Salesforce Billing Managed Package)

          Required Editions

          Available in Lightning Experience in Professional, Enterprise, Unlimited, and Developer Editions with Salesforce CPQ Plus and Salesforce Billing

          Let’s look at an example: A customer purchases seat licenses for a subscription product and then, after a few months, adds more seats.

          Initial Purchase: Customer Buys 10 1-Year Licenses @ $10 per Month

          The customer’s subscription (represented by an asset record) starts January 1 and costs $1,200 for one year. The system generates one asset state period. An asset action represents the initial sale.

          Diagram showing progression: From an order or system, an asset and asset state period are generated. The asset state period extends from January 1 to December 31, with a quantity of 10, an amount of $1,200, and monthly recurring revenue of $100.

          Here’s the dashboard representing the asset’s lifecycle after the purchase.

          Dashboard on a day in May shows a current quantity of 10, a current amount of $1,200, and current monthly recurring revenue of $100. The chart shows the lifecycle ends on December 31, with straight horizontal graph lines for quantity and monthly recurring revenue for 12 months.

          Upsell: Customer Buys 20 More Licenses

          Starting July 1, the customer adds 20 licenses to the initial 10. The system adjusts the original asset state period and adds one: the first period shows the time span when the license quantity is 10, and a second period shows the time span when the quantity is 30. Asset state periods are back to back within a lifecycle, without gaps or overlaps.

          Diagram showing progression: From an order or system, an asset action is generated to represent the upsell increase in quantity. In turn, the total amount of the asset increases by the amount of the action. In addition, the asset state period is shortened, and a second one is generated to represent the time span of the change. The second period extends from July 1 to December 31.

          Here’s the dashboard representing the asset’s lifecycle on a day before the upsell takes effect.

          Dashboard on a day in June shows a current quantity of 10, a current amount of $600, and current monthly recurring revenue of $100. The second asset state period still ends on December 31. The graph lines for quantity and monthly recurring revenue jump up on July 1.
          Dashboard on a day in October shows a current quantity of 30, a current amount of $1,800, and current monthly recurring revenue of $300. The second asset state period still ends on December 31.

          Sometimes the current date falls outside the asset’s lifecycle—that is, the start and end dates of the first and last asset state periods, respectively. In that case, the dashboard shows the current quantity and other data as 0.

          The nightly background process that updates the dashboard and related pages runs at 1:00 AM in the time zone of your org’s server. For more information, contact your Salesforce admin.

           
          Loading
          Salesforce Help | Article