You are here:
Managing Pipelines with Pipeline Inspection
Get an all-in-one single pipeline view, with multiple filtering options and key opportunity changes and insights about the health of your deals. And summarize your pipeline metrics by amount, currency, and number fields to align your view with the way you track your sales.
Required Editions
| View supported editions. |
 Ensuring Sales Rep Accountability with
Pipeline Inspection (English Only)
Ensuring Sales Rep Accountability with
Pipeline Inspection (English Only)
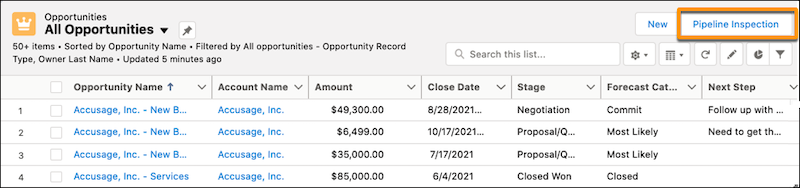
Access Pipeline Inspection from the Opportunities tab.
Pipeline Views and Saved Filters
You can filter the Pipeline Inspection view multiple ways.
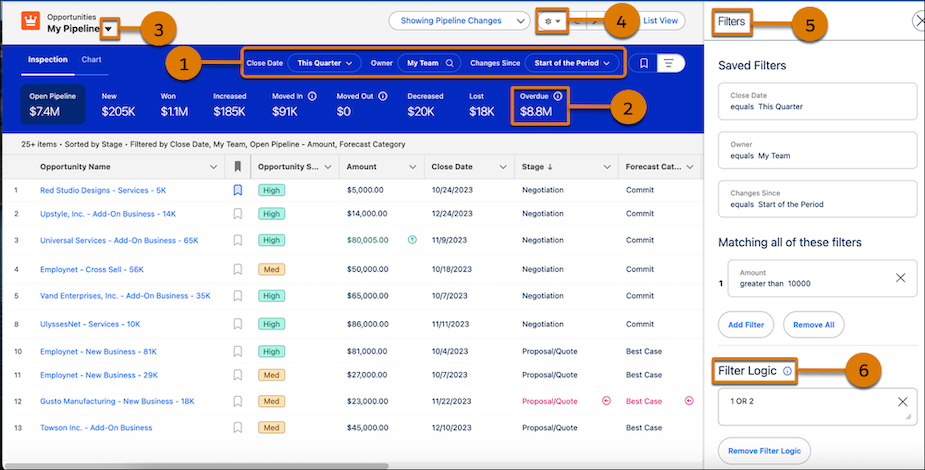
Use the quick filters to narrow the view by time period, sales rep, team, or territory (1). Click any of the pipeline metrics, such as Overdue (2) in the pipeline changes metrics group, to see a list of matching opportunities. To create custom filters and saved views (3), use the List View Controls menu under the gear icon (4). You can create, clone, rename, or delete pipeline views. Add filters to view the opportunities that meet your filter criteria. Using the filter panel, add more criteria such as accounts, amounts, and stages (5), and add filter logic to get an even narrower view of your pipeline (6).
Mark Opportunities as Important
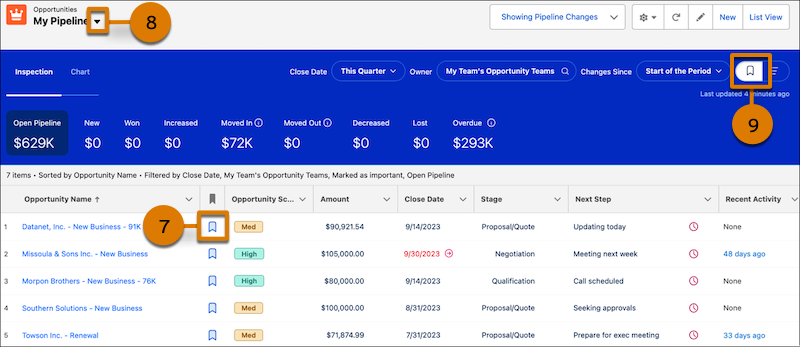
To help you track your priority deals, use the icon next to the opportunity name in the list to mark the opportunity as important (7). To view all the opportunities that you marked as Important, use the My Important Opportunities view in the pipeline views dropdown (8). You can also view just the important opportunities for any other saved view by applying the important opportunities filter (9).
Recent Opportunity Changes
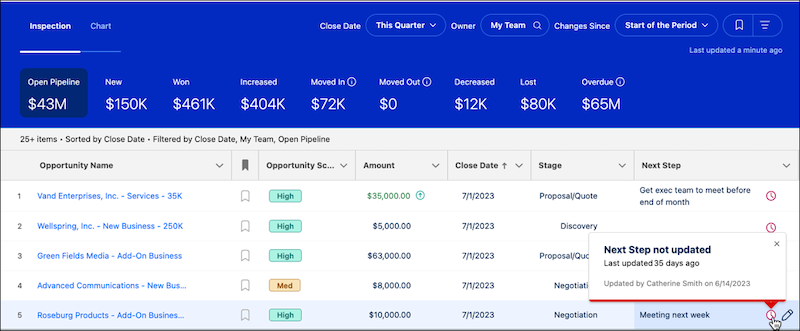
To help you identify deals that need more attention, changes that occurred in the last 7 days are highlighted in the opportunity list. Changes to amounts, close dates, forecast categories, and stages are highlighted with red and green text and arrows. To get more insights, such as what changed, when, and who made the change, hover over the field with a change.
Opportunities with no updates to the Next Steps field in 7 days or more are also called out with a red clock icon.
Einstein Deal Insights and Activity Details
Get a deeper understanding of deal health and activity. AI insights from call recordings, emails, service cases, and other sources are shown in the Insights tab on a side panel. To open the panel, click the side panel icon ![]() .
.
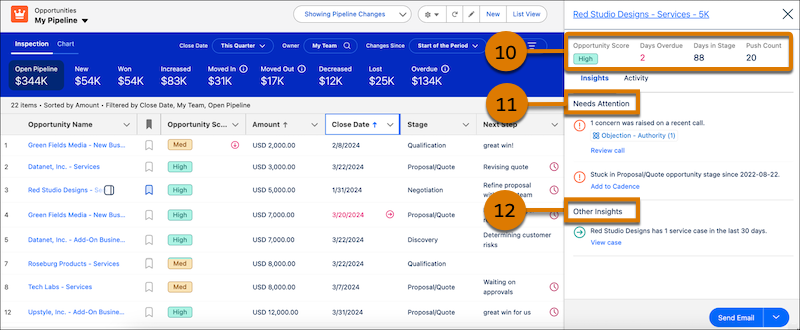
You also get a snapshot of opportunity metrics (10), essential insights that indicate a deal’s likelihood of closing (11), and informational insights about the opportunity or its account (12).
Activity details and aggregate activity counts are shown on the Activity tab, letting sales teams see recent and upcoming activities. And aggregate activity counts help sales managers understand deal activity.
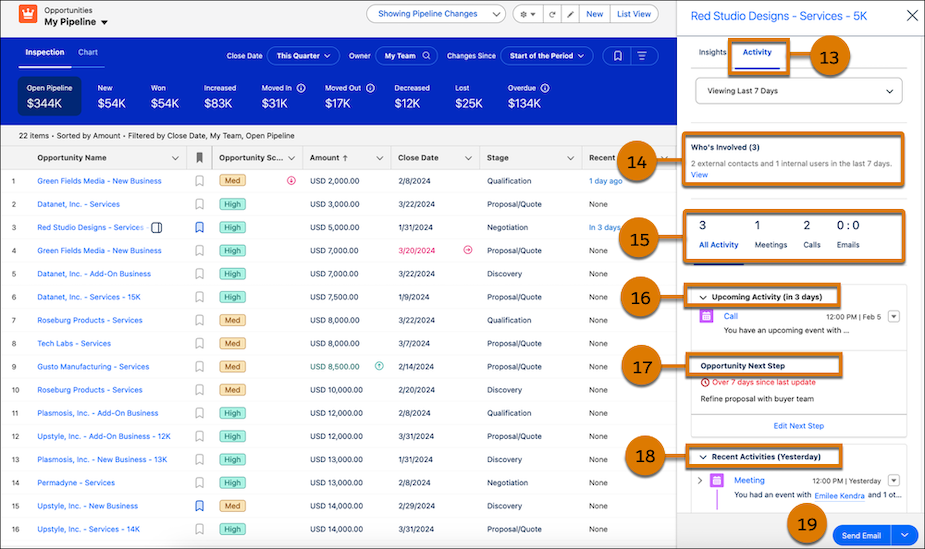
When your admin enables Activity 360 Reporting in Einstein Activity Capture, the Activity tab (13) shows valuable information. There’s a summary (14) of how many internal and external people have been involved in an activity during the selected time period. The total number of activities and the activities broken down by type (15) are also shown. You see upcoming activities (16), the next step (17), and past activity along with relevant insights (18). And you can take immediate action, such as sending an email (19).
Tiered Einstein Opportunity Scores
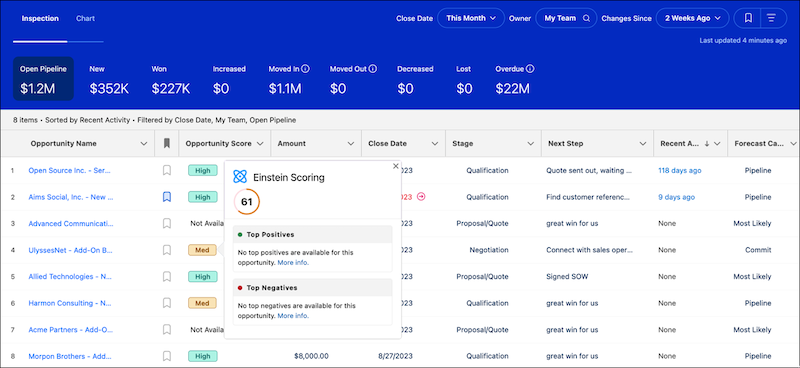
In Pipeline Inspection, opportunity scores are grouped into tiers. The tiers and score ranges are High (67–99), Medium (34–66), and Low (1–33). To see the opportunity score, key factors, and score changes, click the tier. When an opportunity score moves up or down a tier within the last 7 days, an arrow shows in the field.
Inline Editing
Sales teams can keep their opportunities accurate by editing fields inline while they’re reviewing their pipelines. The Amount field is editable inline on opportunities without products in pipeline views. You can edit opportunities of multiple record types inline in the same list view.
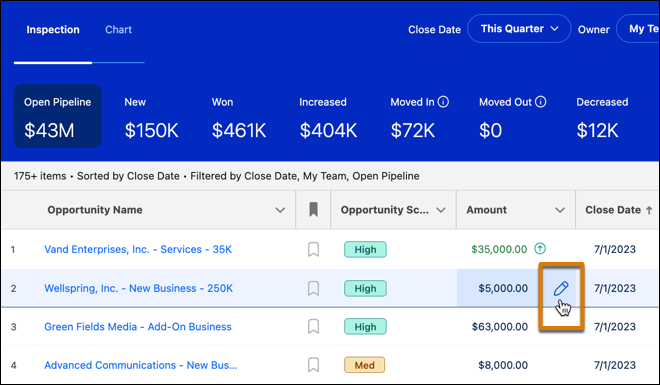
To edit an opportunity field, hover over the field. Similar to other list views, if the field is editable, a pencil appears.
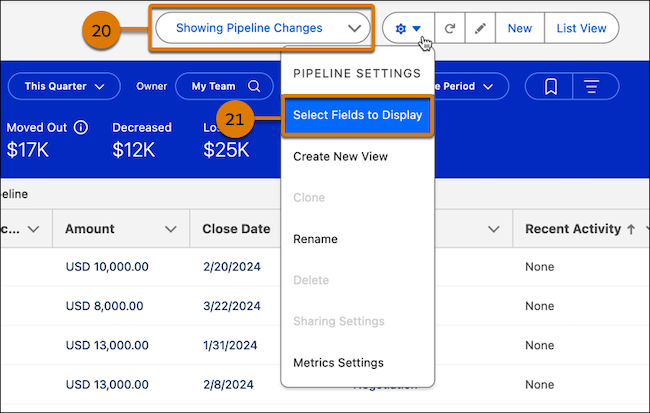
Pipeline Metrics
Use forecast category or pipeline changes metrics groups (20), based on which groups are enabled, to view and filter your pipeline from different perspectives. Change your metrics view using the dropdown menu. To summarize pipeline metrics, select from Amount, Quantity, Expected Revenue, or any custom currency or number field, based on what your Salesforce admin configured. The default field shown in the My Pipeline view is Amount. Set or change the view in the Pipeline Settings menu when you’re creating a view (21).